USD/JPY Weekly Forecast (11th April 2022 – 15th April 2022)

Fundamental view:

The US dollar rallied against its yen counterpart during the trading course of the week. The aggressive stance of fed policymakers was the major catalyst favoring the dollar. The Fed unveiled the monetary policy this week. Minutes from last month’s Federal Open Market Committee (FOMC) meeting made the reduction plan concrete. “Participants generally agreed that monthly caps of about $60 billion for Treasury securities and about $35 billion for agency MBS would likely be appropriate. Participants also generally agreed that the caps could be phased in over a period of three months or modestly longer if market conditions warrant,” stated the minutes. This alongside the hawkish Fed commentary and upbeat US Services PMI data cemented a deal for a 50 bps lift-off in May which strengthened the US dollar.

On the other hand, Yen is also weighed by Japanese vulnerability to oil price fluctuations. Japan imports nearly all of its energy and GDP and her balance of payments will incur more damage from the 30% rise in Brent than the US will from the 28% increase in West Texas Intermediate (WTI). And the Japanese economic data was mixed.

In this week, ISM Non-Manufacturing PMI on 5th April and Current Account n.s.a. on 8th April favored downtrend whereas Household Spending yearly report on 5th April, FOMC Minutes on 6th April and Initial Jobless Claims on 7th April favored uptrend for the pair.

The major economic events deciding the movement of the pair in the next week are BoJ Governor Kuroda Speech at Apr 11, Federal Budget Balance at Apr 12, BoJ Governor Kuroda Speech at Apr 13, US Retail Sales monthly report, Initial Jobless Claims, Michigan Consumer Sentiment at Apr 14 and Fed Industrial Production yearly report at Apr 15.

USD/JPY Weekly outlook:

Technical View:

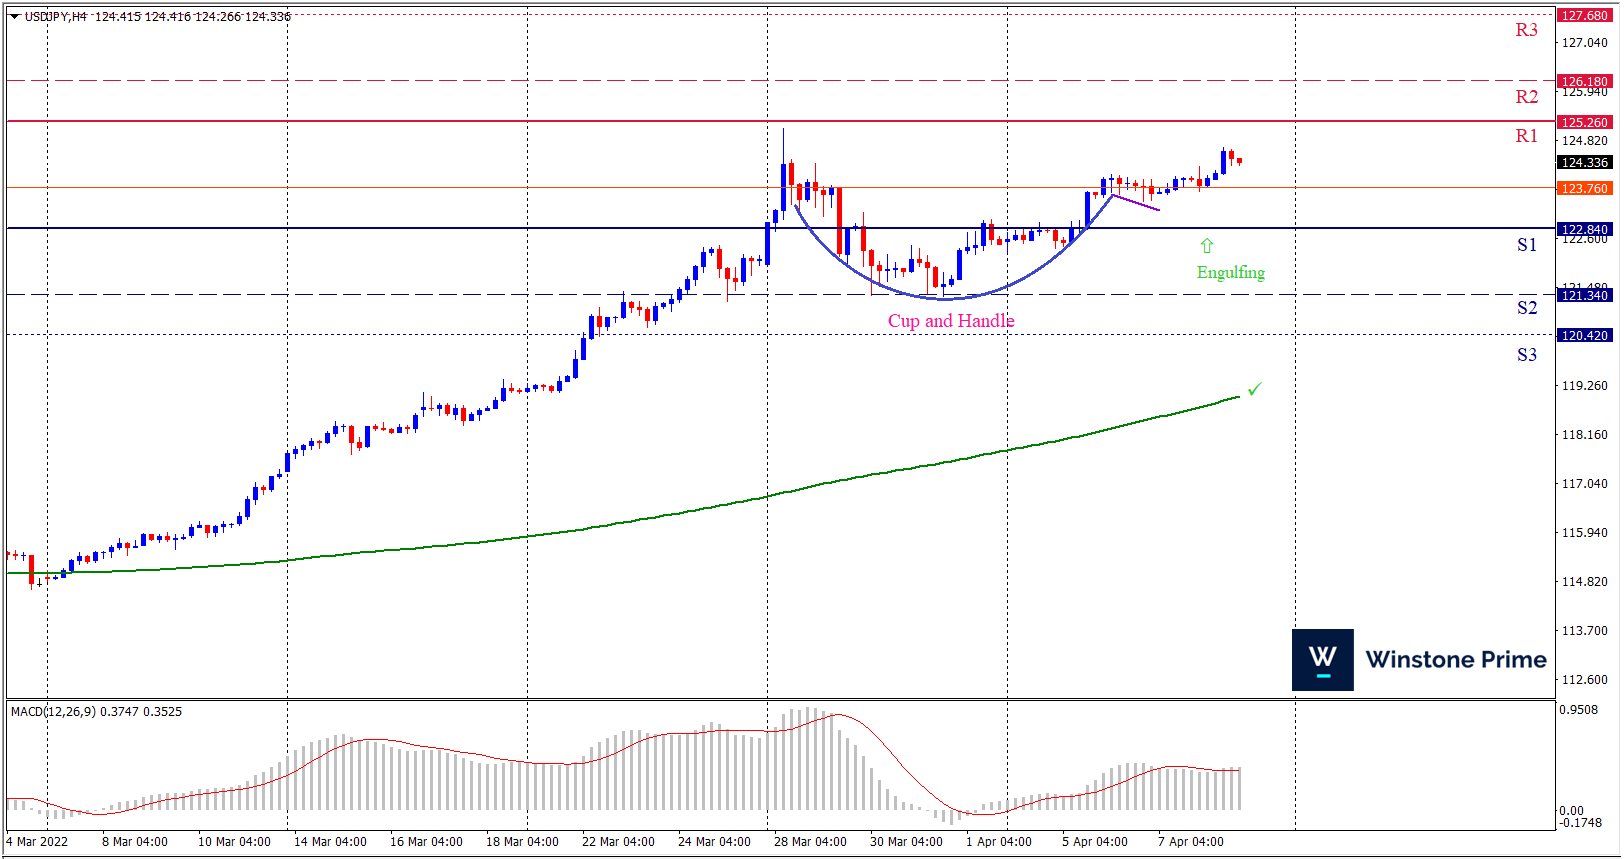
Last week’s high was 0.34% lower than the previous week. Maintaining high at 124.68 and low at 122.26 showed a movement of 242 pips.

In the upcoming week we expect USD/JPY to show a bullish trend. The currency pair is trading above the 200 Simple Moving Average and the MACD trades to the upside. A solid breakout above 125.26 may open a clean path towards 126.18 and may take a way up to 127.68. Should 122.84 prove to be unreliable support, the USDJPY may sink downwards 121.34 and 120.42 respectively. In H4 chart, Formation of cup and handle pattern indicates the trend creating prospects of a bullish trend Along with a bullish engulfing formation braces our expectation.

Preference
Buy: 124.33 target at 126.49 and stop loss at 122.79


Alternate Scenario
Sell: 122.79 target at 120.43 and stop loss at 124.33

GBP/USD Weekly Forecast (11th April 2022 – 15th April 2022)

Fundamental view:

The British pound booked loss against the US dollar amid hawkish Fed-driven and risk-averse market sentiment. The risk-off flows and the dollar’s demand remained the central narrative this week which pushed the pound to book losses. Fed March meeting’s minutes delivered a hawkish surprise. The minutes revealed that the board members outlined plans to reduce the balance sheet by more than $1 trillion a year while hiking interest rates. This alongside the hawkish Fed commentary and upbeat US Services PMI data cemented a deal for a 50 bps lift-off in May, underscoring the monetary policy divergence between the Fed and the BOE.

Moreover, the UK announced a full asset freeze on the largest Russian bank while announcing to end all imports of Russian coal and oil by the end of 2022 which also weighed on the Pound. 

In this week, UK S&P Global/CIPS Services PMI on 5th April and EIA Crude Oil Stocks Change on 6th April underpinned bullish trend whereas FOMC meeting on 6th April and US Initial Jobless claim on 7th April underpinned bearish trend for the pair.

The major economic events deciding the movement of the pair in the next week are UK Manufacturing Production monthly report, UK GDP monthly report at Apr 11, UK Claimant Count Change, Federal Budget Balance at Apr 12, UK CPI monthly report at Apr 13, US Retail Sales monthly report, Initial Jobless Claims, Michigan Consumer Sentiment at Apr 14 and Fed Industrial Production yearly report at Apr 15.

GBP/USD Weekly outlook:

Technical View:

Last week’s high was 0.12% lower than the previous week. Maintaining high at 1.3167 and low at 1.2982 showed a movement of 185 pips.

In the upcoming week we expect GBP/USD to show a bearish trend. The currency pair is trading below the 200 Simple Moving Average and the MACD trades to the downside. Should 1.2951 proves to be unreliable support then the pair may fall further to 1.2874 and 1.2766 respectively whereas a solid breakout above 1.3136 will open a clear path upward to 1.3244 and then will further raise up to 1.3321. Chart formation of bearish butterfly pattern in H4 chart favors prospects of a bearish trend. Bearish harami pattern formation escalates the expectation for a bearish trend.

Preference
Sell: 1.3028 target at 1.2849 and stop loss at 1.3141


Alternate Scenario
Buy: 1.3141 target at 1.3320 and stop loss at 1.3028

EUR/USD Weekly Forecast (11th April 2022 – 15th April 2022)

Fundamental view:

Euro had a bad week against its American rival. The prospects of aggressive rate hike from the Fed Policymakers and the idea that Eastern European crisis would take long to get resolved favored the greenback.  The Russian invasion of Ukraine disturbed the supply chain and the commodity prices went to multi year highs and led to high inflation. Western nations keep on adding sanctions on  Moscow which made the market sentiment sour.

 The European Central Bank and the US Federal Reserve unveiled the minutes of their latest meetings. ECB portrayed that a large number of members believe that the current high level of inflation and its persistence needs immediate further steps toward monetary policy normalization, and said that “the three forward guidance conditions for an upward adjustment of the key ECB interest rates had either already been met or were very close to being met.” Meanwhile, FOMC Minutes were far more aggressive than anticipated. US policymakers “generally agreed” on reducing the balance sheet by $95 billion a month, which will likely begin in May.  A maximum of $60 billion in Treasuries and $35 billion in mortgage-backed securities would be allowed to roll off per month. At the same time, the document hinted at upcoming 50 bps rate hikes, instead of the average 25 bps as hiked in March.

In this week, Eurozone S&P Global Services PMI on 5th April and EIA Crude Oil Stocks Change on 6th April favored the bullish trend whereas FOMC Minutes on 6th April and German Industrial production and US Initial Jobless Claims on 7th April favored bearish trend for the pair.

The major economic events deciding the movement of the pair in the next week are Eurozone ZEW Economic Sentiment Indicator, Federal Budget Balance at Apr 12, ECB Interest Rate Decision, ECB Monetary Policy Press Conference, US Retail Sales monthly report, Initial Jobless Claims, Michigan Consumer Sentiment at Apr 14 and Fed Industrial Production yearly report at Apr 15.

EUR/USD Weekly outlook:

Technical View:

Last week’s high was 1.17% lower than the previous week. Maintaining high at 1.1054 and low at 1.0836 showed a movement of 218 pips.

In the upcoming week we expect EUR/USD to show a bearish trend. The currency pair is trading below the 200 Simple Moving Average and the MACD trades to the downside. Should 1.0790 proves to be unreliable support then the pair may fall further to 1.0704 and 1.0572 respectively whereas a solid breakout above 1.1008 will open a clear path upward to 1.1140 and then will further raise up to 1.1226. Chart formation of a rounding top pattern in H4 chart sets prospects for a bearish trend. Shooting star pattern formation in H4 chart escalates the expectation for a bearish trend.

Preference
Sell: 1.0876 target at 1.0668 and stop loss at 1.1013


Alternate Scenario
Buy: 1.1013 target at 1.1225 and stop loss at 1.0876

Prospects of rate hike favors USD

  • The yellow metal dropped against the greenback amid rising bets on Fed’s tightening policy.
  • Preliminary estimate of the US CPI may bring more uncertainty to the market.
  • Ukraine uncertainty favors the safe haven gold.


Gold dropped against the US dollar during Friday trading session since the US dollar strength backed by prospects of aggressive interest rate hikes by the U.S. Federal Reserve which partially offsets the safe-haven demand fuelled by the heightened Russia-Ukraine conflict.

The greenback is trading high on hawkish stance by a slew of Fed Policymakers who have called for a faster pace of interest rate increases to curb rapid inflation. A stronger. The benchmark U.S. 10-year Treasury yield touched a three-year high in the previous session, increasing the opportunity cost of holding non-yielding bullion.

Minutes of the Fed’s March 15-16 meeting showed deepening concern among policymakers that inflation had broadened through the economy, with many participants prepared to raise rates in 50-basis-point increments in coming months.

A preliminary estimate of the yearly US Consumer Price Index (CPI) at 6.6%, which will release next week, is evidence for the soaring inflation. Federal Open Market Committee (FOMC) members have narrated the neutral rate at 2.4% at which demand will not dampen and growth will not de-escalate. To shift the current interest rates to the neutral rate, the Fed has already announced one or more interest rate hikes by 50 basis points (bps) out of the six interest rate hikes to be announced this year. Thus favoring the gold.

However, Gold is being supported by the Ukraine uncertainty, which caps the USD bulls. The US has widened its actions against Moscow, hitting Russian Sberbank and Alfa Bank and prohibiting investment in the country by American companies. The EU, in the meantime, backed a Russian coal embargo, although without officially confirming it. On Thursday, Ukraine has presented a new agreement proposal, although it includes discussing the situation of Crimea and Donbass, something that Russia considers unacceptable.

XAU/USD 4 Hour Chart:

Support: 1920.7 (S1), 1911.7 (S2), 1903.2 (S3).

Resistance: 1938.3 (R1), 1946.9 (R2), 1955.9 (R3).

The prospects of aggressive rate hike from the Fed favors the US dollar, we expect a bearish trend for XAU/USD.