BTC/USD Weekly Forecast (20th September 2021 – 24th September 2021)

Fundamental view:

Bitcoin showed a uptrend against the greenback in this week. Analysts at Standard Chartered are expecting the Fed to announce the taper next week after the Federal Open Market Committee meets. “The 22 September FOMC will likely signal a tapering decision at the next meeting, providing few details. The interest rates will likely signal 2022 hike, and added hikes in both 2023 and 2024. Whereas Chinese property giant Evergrande’s debt problems may roil financial markets, including cryptocurrencies and traders are cautiously bullish towards Bitcoin.

Ali Martinez – a known crypto analyst – explained on Twitter that Whales are buying bitcoin. Addresses with 10,000 to 100,000 BTC have purchased roughly 50,000 BTC in the last four days. This significant number of tokens has been removed from known cryptocurrency exchange wallets, reducing the selling pressure behind bitcoin. Whereas Yann Allemann and Jan Happel, co-founders of on-chain analytics firm Glassnode, commented on an accompanying chart that “Traders in Bitcoin futures markets remain reasonably bullish with a positive funding rate returning to perpetual swap contracts.”

The major economic events deciding the movement of the pair in the next week are Building Permits at Sep 21, EIA Crude Oil Stocks Change, Fed Interest Rate Decision at Sep 22, Initial Jobless Claims at Sep 23 and Fed Chair Powell Speech at Sep 24 for US.

BTC/USD Weekly outlook:

Technical View:

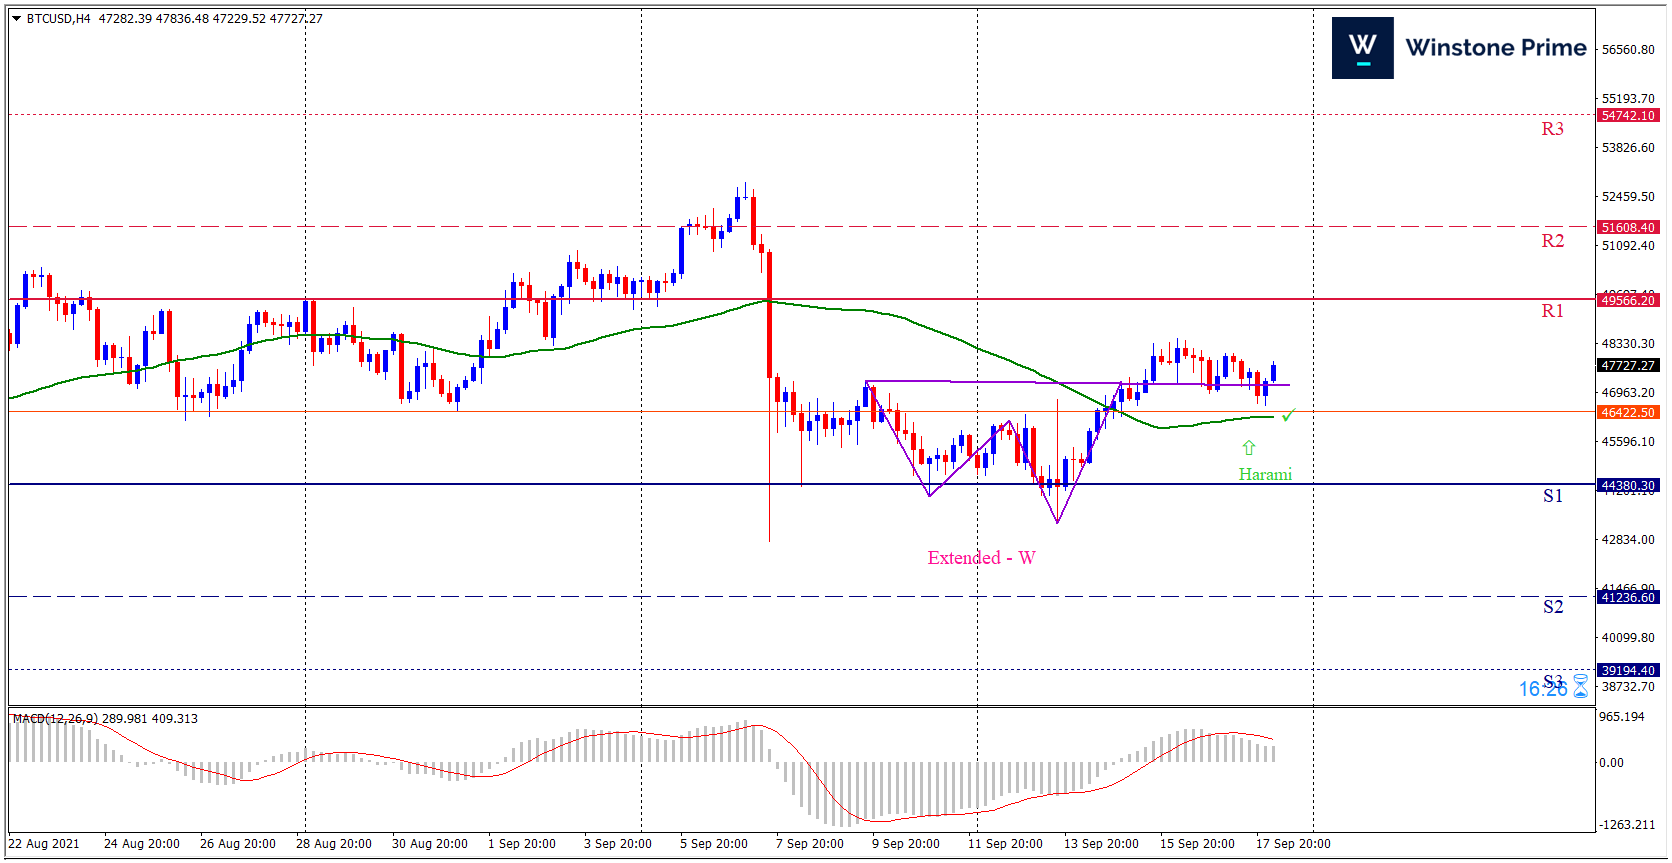
Last week’s high was 8.27% lower than the previous week. Maintaining high at 48464.7 and low at 43278.8 showed a movement of 5185 pips.

In the upcoming week we expect BTC/USD to show a bullish trend. The Instrument is trading above the 50 Simple Moving Average and the MACD trades to the upside. A solid breakout above 49566.2 may open a clean path towards 51608.4 and may take a way up to 54752.1. Should 44380.3 prove to be unreliable support, the BTCUSD may sink downwards 41236.6 and 39194.4 respectively. In H4 chart Extended-W pattern formation favors prospects of a bullish trend. Bullish harami pattern constructs a bullish outlook for the pair in the upcoming week.

Preference
Buy: 47490.5 target at 51607.4 and stop loss at 44375.3
Alternate Scenario
Sell: 44375.3 target at 39195.8 and stop loss at 47490.5

XAU/USD Weekly Forecast (20th September 2021 – 24th September 2021)

Fundamental view:

The yellow metal rallied initially but later fell badly during the trading course of the week. With the news that the Federal Reserve could opt out to delay the reduction in asset purchases led the dollar to weaken against its rivals. But the risk-averse market environment helped the US Dollar Index (DXY) limit its downside and posed a problem for the yellow metal to maintain its bullish momentum.

As per recent news, a strategist told that “If the U.S. economic data continues to surprise on the upside, gold could be in store for another selloff.” We see yields starting to pick up, and the U.S. dollar is strong. This puts pressure on gold” In the upcoming week,  Federal Reserve will announce monetary policy decisions alongside the updated Summary of Projections following the FOMC’s two-day meeting. In case Powell unveils that the Fed will start reducing asset purchases before the end of the year, the USD is likely to gather strength and will led to the fall of the yellow metal.              

The major economic events deciding the movement of the pair in the next week are Building Permits at Sep 21, EIA Crude Oil Stocks Change, Fed Interest Rate Decision at Sep 22, Initial Jobless Claims at Sep 23 and Fed Chair Powell Speech at Sep 24 for US.

XAU/USD Weekly outlook:

Technical View:

Last week’s high was 1.18% lower than the previous week. Maintaining high at 1808.5 and low at 1745.2 showed a movement of 633 pips.

In the upcoming week we expect XAU/USD to show a bearish trend.  The Instrument is trading below the 200 Simple Moving Average and the MACD trades to the downside. A solid breakout below 1729.8 may open a clean path towards 1705.9 and may take a way down to 1666.5. Should 1793.1 prove to be unreliable resistance, the XAUUSD may raise upwards 1832.5 and 1856.4 respectively. In H4 chart descending scallop pattern favors prospects of a bearish trend. Also to be noted bearish engulfing formation exerts the expectation of downtrend for the pair.

Preference
Sell: 1753.6 target at 1706.9 and stop loss at 1777.2


Alternate Scenario
Buy: 1777.2 target at 1825.4 and stop loss at 1753.6

AUD/USD Weekly Forecast (20th September 2021 – 24th September 2021)

Fundamental view:

The Australian dollar has fallen a bit during the course of the trading week. The draconian Australian approach to the Delta variant led to the collapse of the down-under job market in August with the largest loss of employment since May 2020. Delta closures and restrictions reported in several places, led to the fall of the Aussie. The AUD/USD is highly sensitive to the global risk environment and the uncertainty in China. On the other hand, The Federal Reserve’s possible taper announcement at its Wednesday meeting reinforces the notion that US rates are headed higher, even if the timing remains undecided.

US Core CPI monthly report on 14th Sep and US TIC Net Long-Term Transactions on 16th Sep created downtrend whereas Australia NAB Business Confidence on 14th Sep and Australia Employment Change on 16th Sep created downtrend for the pair.

The major economic events deciding the movement of the pair in the next week are RBA Meeting Minutes, US Building Permits at Sep 21, RBA Assistant Governor Bullock Speech, US EIA Crude Oil Stocks Change, Fed Interest Rate Decision at Sep 22, US Initial Jobless Claims at Sep 23 and Fed Chair Powell Speech at Sep 24.

AUD/USD Weekly outlook:

Technical View:

Last week’s high was 1.25% lower than the previous week. Maintaining high at 0.7375 and low at 0.7261 showed a movement of 114 pips.

In the upcoming week we expect AUD/USD to show a bearish trend.  The currency pair is trading below the 200 Simple Moving Average and the MACD trades to the downside. A solid breakout below 0.7224 may open a clean path towards 0.7186 and may take a way down to 0.7110. Should 0.7338 prove to be unreliable resistance, the AUDUSD may raise upwards 0.7414 and 0.7452 respectively. In H4 chart descending triangle pattern breakout favors prospects of a bearish trend. Also to be noted hanging man formation exerts the expectation of downtrend for the pair.

Preference
Sell: 0.7262 target at 0.7187 and stop loss at 0.7305


Alternate Scenario
Buy: 0.7305 target at 0.7411 and stop loss at 0.7262

USD/JPY Weekly Forecast (20th September 2021 – 24th September 2021)

Fundamental view:

Greenback showed a uptrend against the Japanese yen in this week despite somewhat conflicting directions from US economic data. Consumer price gains in the US have moderated slightly in August and gave the Federal Reserve additional logic for delaying their bond taper. Whereas Federal Reserve policy as enumerated many times by Chair Powell, focused exclusively on the labor economy restoring to its condition before the pandemic. On the other hand, Japanese data produced no major surprises. Exports in August were weaker than forecast but imports were higher.

Japan BSI Large Manufacturing on 13th Sep and US Business Inventories monthly report on 16th Sep created uptrend whereas US CPI monthly report on 14th Sep and US Michigan Current Conditions on 17th Sep created downtrend for the pair.

The major economic events deciding the movement of the pair in the next week are US Building Permits at Sep 21, BoJ Interest Rate Decision, US EIA Crude Oil Stocks Change, Fed Interest Rate Decision at Sep 22, US Initial Jobless Claims at Sep 23, Japan Markit Manufacturing PMI and Fed Chair Powell Speech at Sep 24.

USD/JPY Weekly outlook:

Technical View:

Last week’s high was 0.26% lower than the previous week. Maintaining high at 110.15 and low at 109.10 showed a movement of 105 pips.

In the upcoming week we expect USD/JPY to show a bullish trend. The currency pair is trading above the 200 Simple Moving Average and the MACD trades to the upside. A solid breakout above 110.37 may open a clean path towards 110.79 and may take a way up to 111.42. Should 109.32 prove to be unreliable support, the USDJPY may sink downwards 108.69 and 108.27 respectively. In H4 chart, Formation of rounding bottom pattern indicates reversal of the trend creating prospects of a bullish trend Along with a hammer formation braces our expectation.

Preference
Buy: 109.95 target at 110.78 and stop loss at 109.28


Alternate Scenario
Sell: 109.28 target at 108.39 and stop loss at 109.95