Improvement in Japan’s export favors yen

The dollar traded near low on today as traders looked to next week’s Federal Reserve policy meeting for indications on how soon the U.S central bank will start to taper stimulus and also Japan exports increased peak place. The Federal Open Market Committee’s (FOMC) two-day policy meeting ending Sept. 22 should provide some clarity on the outlook for both tapering and eventual interest rate hikes. Tapering typically lifts the dollar as it suggests the Fed is one step closer to tighter monetary policy. It also means the central bank will be buying fewer debt assets, in effect reducing the number of dollars in circulation and increasing the currency’s value.

Today’s Reuters report suggests that Production at U.S. factories slowed more than expected in August amid disruptions from Hurricane Ida and lingering shortages of raw materials. Manufacturing output increased 0.2% last month, the Federal Reserve said on September 15. Data for July was revised to show production surging 1.6% instead of 1.4% as previously reported. Economists polled by Reuters had forecast manufacturing production would gain 0.4%. The raw materials crunch has been worsened by the latest wave of infections driven by the Delta variant of the coronavirus, primarily in Southeast Asia, as well as by congestion at ports in China.

Meanwhile U.S. authorities arrested more than 195,000 migrants at the U.S. border with Mexico in August, according to government figures released on Wednesday, deepening the humanitarian and political challenge confronting U.S. President Joe Biden as he struggles to curb the high numbers. While the numbers of arrests dipped slightly compared to July, they represent a increase compared with August 2019 when numbers had spiked before the coronavirus pandemic curbed migration around the world. Border arrests have hovered around 20-year highs in recent months.

While looking into Japan, exports extended double-digit gains in August, led by strong shipments of chip manufacturing equipment, although the pace of growth weakened as COVID-19 hit key Asian supply chains and slowed factory production. The trade growth is unlikely to dispel worries about the outlook for Japan’s economy, which has not yet recovered to pre-pandemic levels after taking an enormous hit from a collapse in global trade in the first quarter of 2020. Exports rose 26.2% in August compared with the same month a year earlier, the Ministry of Finance said on Thursday, marking the sixth straight month of double-digit growth as strong demand for chip-making equipment offset slowing U.S and European Union-bound shipments of cars.

Exports to the United States, the world’s top economy, soared 22.8%, as strong demand for power-generating machines offset a decline in car shipments. Shipments to Asia as a whole gained 26.1%, their slowest pace in five months, while those to the European Union advanced 29.9% in August. Imports jumped 44.7% in August compared with the same month a year earlier, versus the median estimate for a 40.0% increase, due to stronger demand for fuel and medical goods. That brought a trade deficit of 635.4 billion yen ($5.81 billion), the largest shortfall since December 2012 and bigger than the median estimate for a 47.7 billion yen deficit.

On the other hand Japan and the Association of Southeast Asian Nations agreed Wednesday to step up their efforts toward economic recovery following the coronavirus pandemic that has weighed on industrial output. The two sides will expand an action plan adopted last year covering goals on strengthening the resilience of supply chains, guaranteeing smooth trade procedures and promoting digital technology, their economy ministers said in a joint statement released after a videoconference report by kyoda news.  During the meeting, the ministers also agreed to ensure the entry into force of the Regional Comprehensive Economic Partnership free trade agreement by early January. The megadeal, also involving China, South Korea, Australia and New Zealand, was signed last year.

USD/JPY 4 Hour Chart:

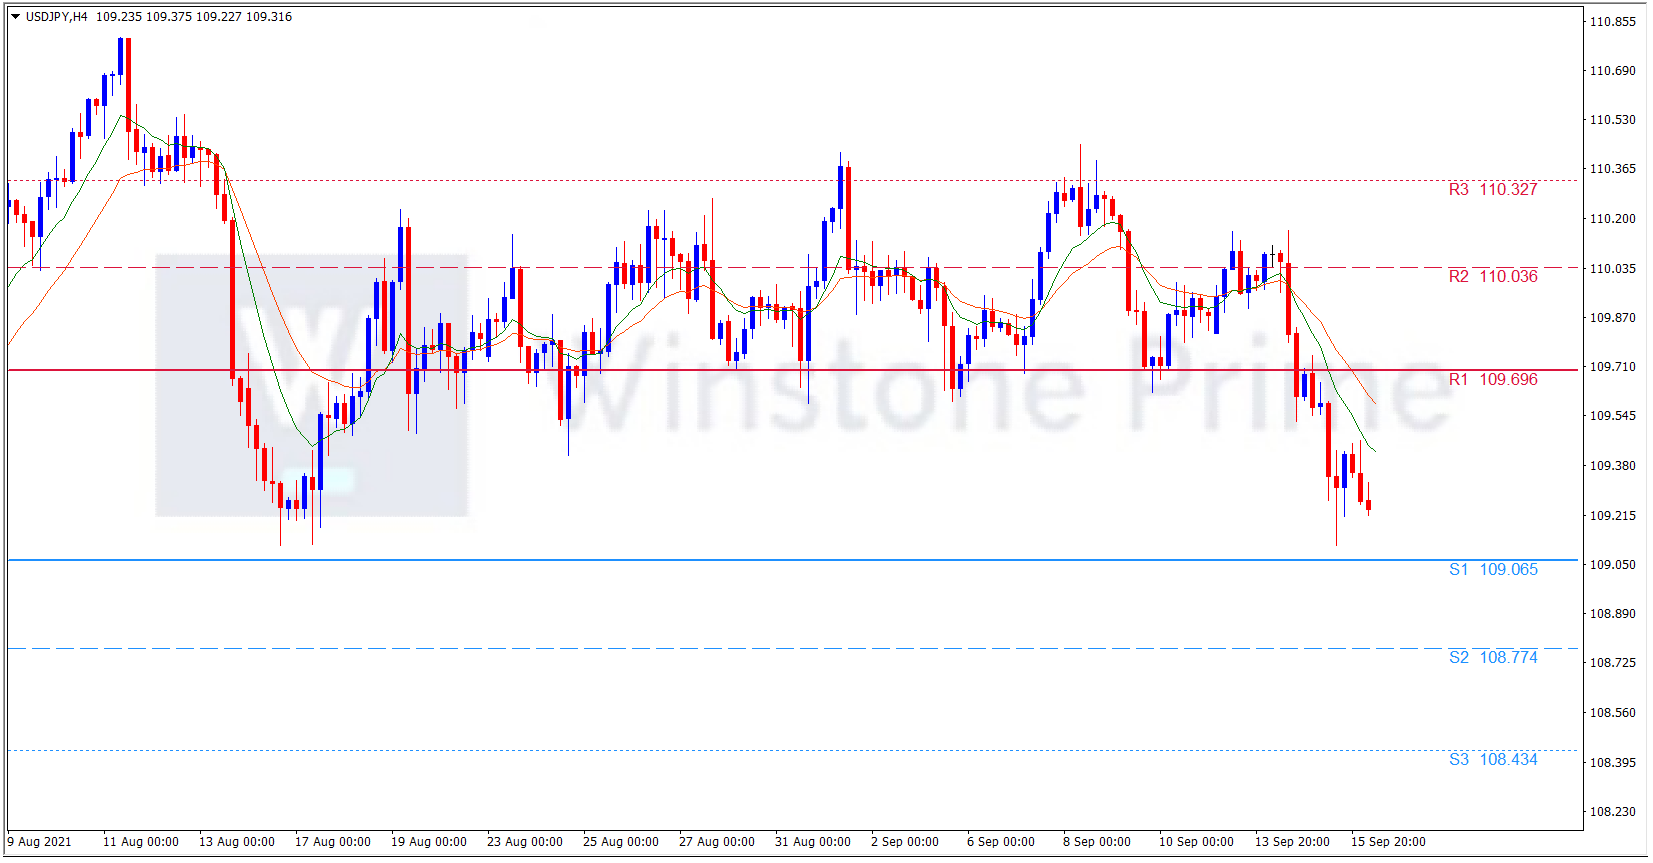
Support: 109.07 (S1), 108.77 (S2), 108.43 (S3).

Resistance: 109.70 (R1), 110.04 (R2), 110.33 (R3).

Being Japan exports showing strong growth and worries over the US dollar ahead of FOMC and US factory production slower the US economy. We expect a bearish trend for USD/JPY.

How PPI effect Forex Market?

PPI is a major economic data due to its signaling effect on future expected inflation. It reflects the change in the cost of products sold by various manufacturers and industries. It is therefore a precursor to underlying inflation and is closely watched by traders.  Forex Traders monitor PPI for the positive relationship between interest rates and inflation, but ultimately, traders are concerned with how the resultant interest rate changes are likely to affect currency pairs.

So let’s take a look at the “PPI Index” aspect of these reports to see how they are interpreted in the foreign exchange market.

What is PPI?

The Producer Price Index or PPI is a monthly report released by the Bureau of Labor and Statistics that measures the change in the selling prices or wholesale prices received by domestic producers for their output.  PPI measures prices for producers. The PPI is not as widely used as the CPI but it is still considered to be a good indicator of inflation.

Who produces PPI?

Governments generally produce wholesale inflation indices. For example, in the United States, the Bureau of Labor Statistics calculate the Producer Price Index. This group is part of the Department of Labor. The Bureau of Labor Statistics uses 10,000 individual products to come up with its producer price index. The data includes information from sectors including construction, agriculture, manufacturing, technology and mining.

How PPI is measured

The Producer Price Index (PPI) is a family of indexes that measures the average change over time in selling prices received by domestic producers of goods and services. Released by the Bureau of Labor Statistics, PPI is created using data collected from a mailed survey of retailers selected randomly. PPIs measure price change from the perspective of the seller. PPI examines three production areas; commodity-based, processing-based companies and industrial-based.

  • First Stage – The Commodity Index, which tracks the price fluctuations from month to month for commodities such as crude oil and coal.
  • Second Stage – The Processing Index, which tracks the prices that are paid for goods sold to manufacturers that will then add value by producing finished products.
  • Third Stage – The Industry Stage, which is the measurement of manufacturing output.


Why PPI is important

  • Inflation is probably the second most watched indicator after unemployment data, as it helps investors deduce the future direction of monetary policy. The core PPI can serve multiple roles in improving the investment-making decision because it can serve as a leading indicator for CPI. When producers are faced with input inflation, those rising costs are passed along to the retailers and eventually to the consumer.
  • PPI presents the inflation picture from a different perspective than CPI. Although changes in consumer prices are important for consumers, tracking PPI allows one to determine the cause of the changes in CPI. If, for example, CPI increases at a much faster rate than PPI, such a situation could indicate that factors other than inflation may be causing retailers to increase their prices. However, if CPI and PPI increase in tandem, retailers may be simply attempting to maintain their operating margins.
  • The producer price index can identify various price alterations and changes before the goods enter the marketplace. Therefore, the PPI comes in considerably handy for the government to formulate adequate fiscal and monetary policies.


What Can Happen to a Forex Pair After The Release of a PPI Report?

The PPI report does not directly affect currency pairs, but because it is released before the CPI report, it serves as a valuable tool to predict rate of inflation. Since inflation is a sign that the purchasing power of a nations currency is reducing and each unit of local currency purchases fewer goods and services, a rise in rate of inflation usually has a negative effect on a currency.

The key to the producer price index is whether it is in line with expectations. If a producer price index is larger than expected, it can push interest rates higher and increase currency value. For example, if European PPI is more robust than expected, the result could be a stronger Euro. Alternatively, if a producer price index is weaker than expected, it can drive an exchange rate lower. For example, if US PPI is more fragile than expected, the dollar could decline.

Conclusion:

The PPI index is a crucial gauge of wholesale inflation. Wholesale inflation is significant because it can spill over into consumer inflation and erode spending. Thus, the most valuable component of the PPI data is the signaling effect it provides to the market. In the foreign exchange market, traders are very concerned about the index. If the producer price index is higher than expected, there is the possibility of inflation. The central bank may implement a tightening monetary policy, which has a positive impact on the country’s currency; if the producer price index falls, it will have the opposite effect. The PPI index is generally released once a month and can be found through our Winstone Prime Economic Calender.

CPI data favors greenback

The Greenback has gained some moment after the release of US CPI data yesterday. After several months of US inflation measurements, the August data offered some consolation for the “team transitory”, that the rise in prices caused by the reopening of the economy in the Federal Reserve and elsewhere will soon subside. Still, numbers do not solve the big inflation debate. Many economists point to persistent supply chain problems and rising wages as reasons for inflation to remain high for months to come.

The consumer price index rose 0.3% more than forecast since July, driven by a decline in used cars, airfares and auto insurance. Those divisions have been playing a key role in CPI molds in recent months. Annual inflation was 5.3%, down from an pandemic peak two months ago. Aneta Markovska the U.S. chief financial economist in Jefferies says that “It was a victory for the interim camp, but I do not think the debate is over.”. There are still a lot of reasons to expect higher inflationary pressures in the next three to six months.”

As per Bloomberg report “Snarled supply chains and shortages of materials -– two key drivers of pandemic inflation –- helped push prices for household furnishings up a record 1.2% last month. Food inflation remains elevated, and even with the smaller monthly gain in restaurant prices, diners are paying 4.7% more than they were a year ago. That’s likely because leisure and hospitality wages have risen 10.3% over that period, Andrew Hollenhorst and Veronica Clark, economists at Citigroup Inc., said in a note. A few categories in the latest CPI report showed limited inflation. Compared with August of last year, wireless telephone services posted the biggest decline since October 2019 and drug costs fell the most in six months”.

U.S. government bonds gained on expectations the August numbers will ease pressure on the Fed to start tightening monetary policy. Yields on 10-year treasuries are down and the central bank is will meet next week. The central bank will hold a two-day monetary policy meeting next week and investors are eager to know if an announcement will be made. The tapping dollar will benefit as the central bank points out that it is one step closer to a tight monetary policy. The central bank will buy less debt assets, which will effectively reduce the number of dollars in circulation. Investors coped with declining inflation and focused on the uncertainty about U.S. growth that is now clouded by the economic impact of the delta variation.

On the other hand, the measure of Australian consumer sentiment soared in early September, and the pace of vaccinations has increased significantly across the states as strict corona virus controls will soon be relaxed amid hopes. The Westpac-Melbourne Institute consumer sentiment index, released on Wednesday, rose 2.0% in September, rebounding a 4.4% fall in August. For those who have at least been fully vaccinated, sentiment in New South Wales rose 5.3% after the state government flagged the easing of restrictions in mid-October.

AUD/USD 4 Hour Chart:

Support: 0.7297 (S1), 0.7275 (S2), 0.7236 (S3).

Resistance: 0.7357 (R1), 0.7395 (R2), 0.7417 (R3).

Amidst this above catalysts the US dollar is on the uptrend among US CPI data. We expect a bearish trend for AUD/USD.

ECB’s move favors euro

The euro pair is strong as investors believe a strong eurozone economic recovery will outweigh the risks from the global recession. European investors were comforted last week by the European Central Bank raising its growth and inflation forecasts for this year and beyond as the eurozone economy recovers faster than expected from the pandemic shock. Economic-sensitive sectors, including banks, oil and gas and construction and materials, rose 1% to 1.3%, while utilities rose 1.2%.

The attention of Euro traders are now on the next meeting on October 28 and, most importantly, on December 16. In particular the December meeting can end with a summary of the central bank’s support for the “direct” eurozone economy. Nevertheless, now that the ECB has revised its inflation target to 2022 and has “reconsidered” its epidemic emergency purchase plan, the euro will likely be heading upwards, especially if the ECB’s hawks are pressed to act quickly.

At the same time European Union’s (EU) rush towards deeper economic ties with Indo-Pacific nations, reported by Nikkei Asia. The news said, China is at the center of the EU’s concerns, although the document calls for a ‘multifaceted engagement with Beijing and is restrained in its direct criticism. It added the draft strategy warns instead that tensions around contested territories and maritime zones, such as in the South China Sea and the Taiwan Strait, ‘may have a direct impact on European security and prosperity. But this news did not have a impact on Euro pair.

On the other hand greenback is rough ahead of the key US data, namely the Consumer Price Index (CPI) for August later in the session for clues on the timing of policy tightening by the Federal Reserve. The resolution that followed Fed’s Jerome Powell’s Jackson Hole speech recently disappeared after US data, mainly on secondary employment publications and the producer price index (PPI). Still, the monthly employment report was sluggish and the Fed is challenging the hawks.

The immediate focus is on the US consumer price data which will be released at 1230 GMT. Economists expect the CPI, the key indicator of eliminating turbulent energy and food prices, to rise to 0.3% August from July. Its annual inflation fell to 4.2% from 4.3% in July. Overall consumer price inflation is expected to fall to 5.3% from 5.4% in July. Inflation is at an extraordinary level as the core CPI is still above 4%. Powell has been saying that inflation will be volatile since March but the central bank will probably have to correct its wording in the next policy statement. The central bank will hold its policy meeting next week.

However, Patrick Harker, chairman of the Federal Reserve Bank of Philadelphia, avoided signaling what the US Federal Reserve would do next week, but quickly cut back on buying US dollars earlier in the week. On the contrary, DXY recently challenged the bulls by easing the US-China conflict and reducing Iran’s readiness to hand over trial rights at the nuclear plant to the Greenback’s asylum claim. On the same line were stimulus and vaccine optimism, as well as cautious mood amid a light calendar and before the key data.

EUR/USD 4 Hour Chart:

Support: 1.1781 (S1), 1.1751 (S2), 1.1733 (S3).

Resistance: 1.1828 (R1), 1.1846 (R2), 1.1875 (R3).

Amidst these above catalysts the greenback remains downtrend ahead of Fed’s tapering talks and traders are now waiting for US inflation data which can change the move. As of now we expect a bullish trend for EUR/USD.