Phases of Trend trading and how to trade it

Trading with the trend is one of the safest ways of engaging the financial markets and a great strategy for maximizing profits. Many analysts use trend trading strategies as one of their primary approaches to the markets. In addition, before making a trade or issuing a signal, they always confirm which side of the trend they are on. Meanwhile a significant portion of traders have incomplete knowledge of why trends form in the Forex market.

There is saying in the Forex market is that “the trend is your friend”. Let’s learn about the key phases of the market movement and check out the strategies of trend trading in this article.

Trend Trading

Trend trading is a strategy that involves using technical indicators to identify the direction of market momentum. It is based on the idea that markets have an element of predictability. Analyzing historical trends and price movements a trader will be able to forecast what could happen in the future. Trend trading strategies are designed to help you identify trends as early as possible and exit the market before they reverse.

Every financial market will make trends in three phases.

Phase 1 – Imbalance

The first phase in each trend is created by one set of orders coming into the market which are greater in size than the current orders causing the trend.

Example:

If AUD/USD is in an uptrend, it means overall there are more buy orders coming into the market than sell orders. For the market to move lower, traders would need to place sell trades which are bigger in size than the traders placing buy trades who are causing the market to advance higher. If enough sell orders come into the market eventually all the buy orders will be consumed and the market will not be able to continue moving higher. With the buy orders being overwhelmed by the sell orders the market price will begin to decline.

Note: The imbalance phase occurs at the beginning of every trend in the market no matter what time frame the trend is occurring on.

Phase 2 – Liquidation

Liquidation is a term used to describe what happens when a trader closes a losing trade. Typically this is by the market hitting their stop loss, but in a lot of cases traders end up closing their trades manually due to other market reasons. The liquidation phase is a result of the imbalance that occurs in the first phase.

The resulting movement created by the order imbalance in phase 1 makes traders who had trades placed in the opposite direction to which the imbalance occurred to close their positions at a loss. These traders, who are closing their losing trades, add more sell orders into the market which further propels the decline in the market price.

Note: The duration of the movement generated by the liquidation phase is entirely dependent on how many traders had trade trades open counter to the direction of which the imbalance occurred.

Phase 3 – Awareness

It is also called the awareness phase. This phase is a consequence of the market movement generated by the first two phases. When the first and second phases are complete the market will have moved far enough for traders to identify the current movement as a new trend, which leads them to begin placing, buy or sell trades.

Trend trading strategies

When trading a trend-based strategy, traders usually pick the major currencies as well as any other currency utilizing the dollar because these pairs tend to trend and be more liquid than other pairs. Liquidity is important in trend-based strategies. The more liquid a currency pair, the more movement (Liquidity) we can expect. The more movement a currency exhibits, the more opportunities there are for price to move strongly in one direction as opposed to bouncing around within small ranges. Other than eyeballing price movement, you can make use of technical tools can determine whether a currency pair is trending or not.

1. ADX trend Strategy

Using the Average Directional Index indicator or ADX you can determine the market is trending. It is developed by J. Welles Wilder, this indicator uses values ranging from 0-100 to determine if the price is moving strongly in one direction, i.e. trending, or simply ranging. If the Values are more than 25 usually indicate that price is trending or is already in a strong trend. The higher the number is, the stronger the trend. However, the ADX is a lagging indicator which means that it doesn’t necessarily predict the future. It also is a non-directional indicator, which means it will report a positive figure whether the price is trending up or down.

Here we have given example for ADX trend indicator showing an Uptrend

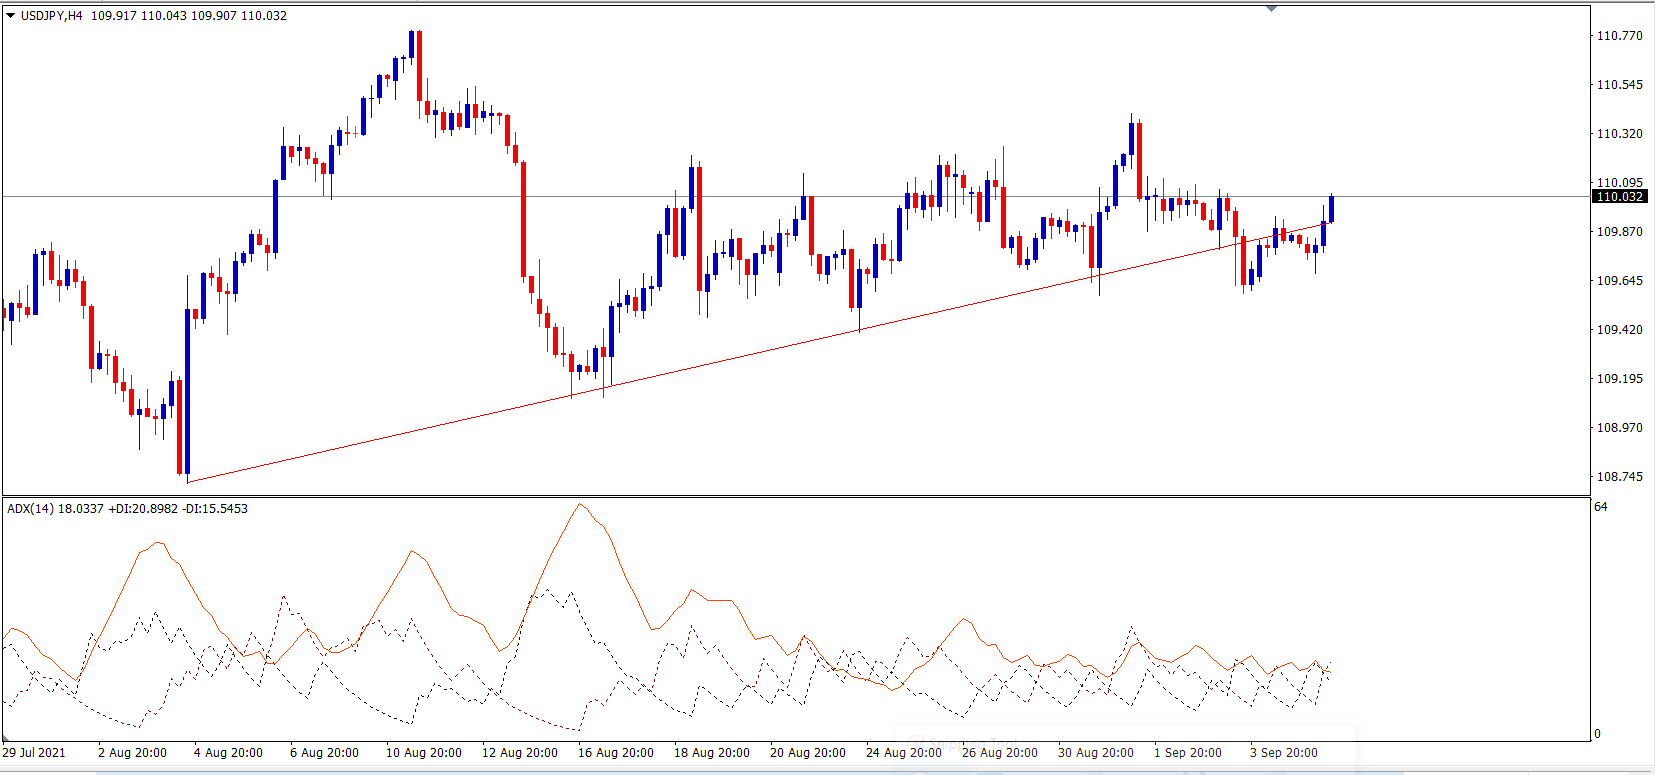
Price is clearly trending upwards even though ADX is lesser than 25.

2. Simple Moving Average Crossover Strategy

A moving average crossover is another way to identify a trend. Many investors view currency pair exchange rates on a chart that tracks a moving average. A crossover occurs when a short-term moving average of a currency pair price increases above or declines below a longer-term moving average of a currency pair price. For example place a 7 period, a 20 period, and a 65 period Simple Moving Average on your chart.

Here we have given example for Moving Average trend indicator showing an Up and downtrends.

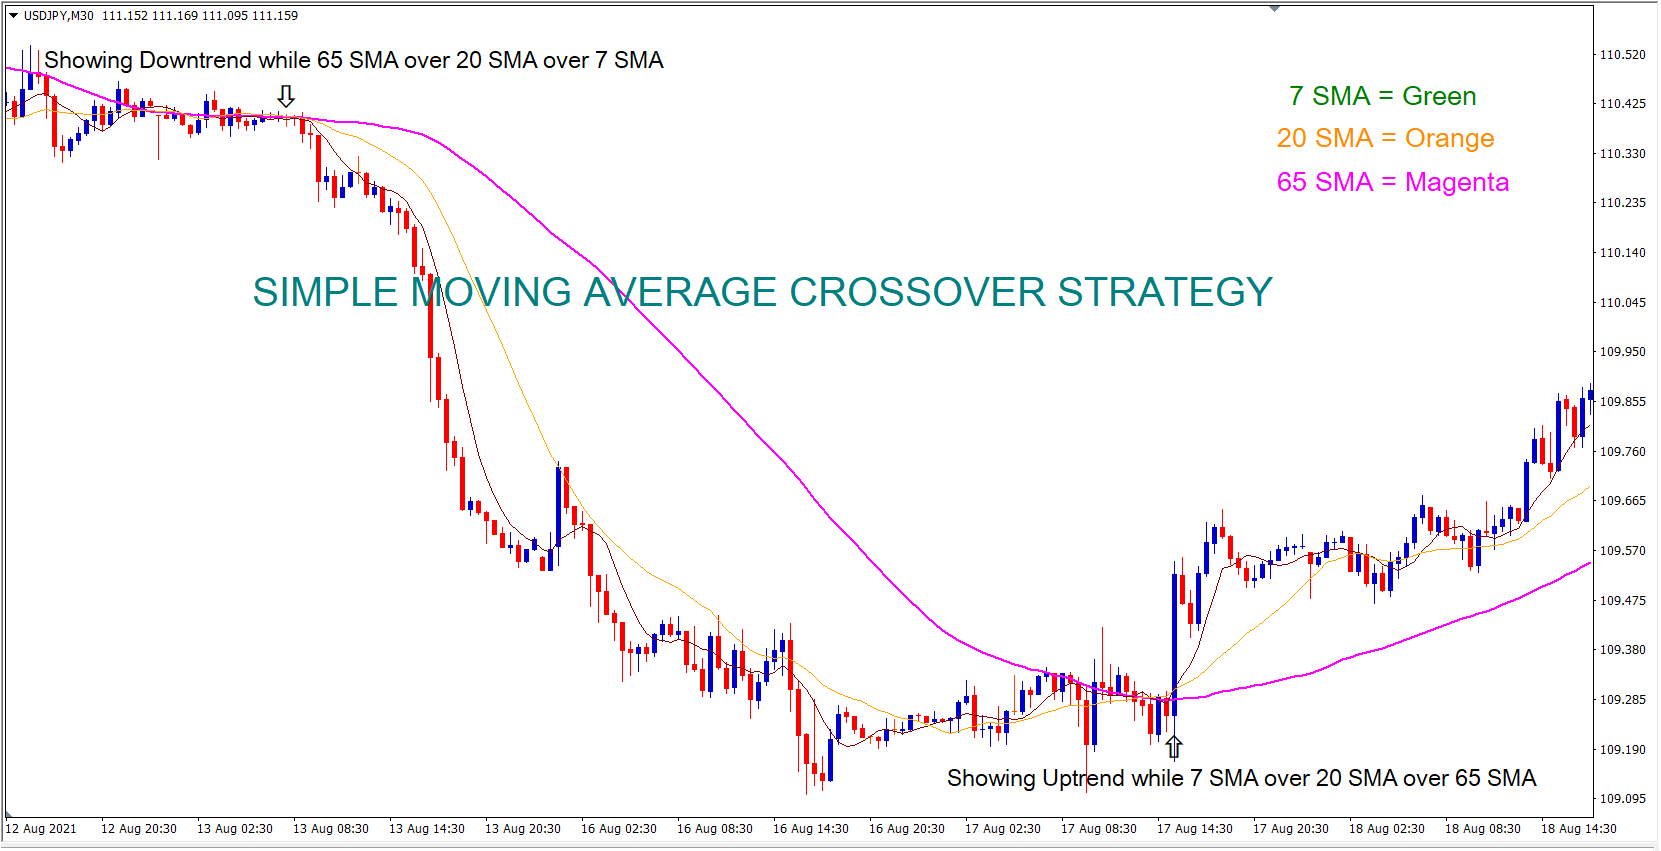
When the three SMAs compress together and begin to fan out will create a trend.  If the 7 period SMA fans out on top of the 20 period SMA and the 20 SMA on top of the 65 SMA, then the price is trending up. On the other hand, if the 7 period SMA fans out below the 20 period SMA, and the 20 SMA is below the 65 SMA, then the price is trending down.

Downtrends can be confirmed when the price is in the sell zone. Uptrend’s can be confirmed when the price is in the buy zone. There are quite a few ways of quantifying a trend. Many traders like to rely on indicators such as moving averages to assist with identifying these trends.

Conclusion

Trends are essential for traders to be able to make money in the Forex markets. Without a trend, obtaining profit would not be possible which is why correct understanding of how trends are created in the market is essential in your ability to not only making profits, but to time trade entries and exits. There is never anything concrete with trend, meaning you never know how long they will last for, so try to take advantage of them when they do occur. Trend trading is the most popular trading strategy used in the financial markets and it involves identifying long-term tendencies either higher or lower.

Before we build a strategy, we first need to get comfortable with an inevitable fact: no trading strategy will work all the time. Trend following is not a short-term method, and patience and determination are as important as correct analysis as a result. Based on fundamentals, technical and future market news will exhibit distinct “flavors,” or conditions, at various times.

Finally the truth is you’ll never know for sure. That’s why you must always have a stop loss and manage your risk properly.

Boris Johnson’s move impacts pound

The cable pair seems to be under pressure among some reasons in economic conditions and New rules of Britain. This week, British Prime Minister Boris Johnson will set out his plans to manage the COVID-19 pandemic in the winter months, announcing a decision to scrap the introduction of vaccine passports and steps to end some emergency powers. Johnson, under fire from some in his governing Conservative Party for raising taxes to fix a health and social care crisis, looks set to try to soothe those critics by ditching plans to introduce passports despite an increasing number of coronavirus cases.

Speaking to broadcasters, Health Minister Sajid Javid said he did not anticipate more lockdowns and that the vaccine passports would not be introduced in England, as the government depends instead on vaccines and testing to defend the public. He told the BBC he was not “anticipating any more lockdowns” but would not take the measure off the table, that the government would not go ahead with vaccine passports to allow people to attend mass events and he wanted to “get rid of” PCR tests for travellers as soon as possible.

Javid added the government would remain “cautious”, but “the vaccine program, our testing program, our surveillance program, the new treatments… this is all our wall of defence and whilst there’s a lot of virus around, it is working”. Britain, which has one of the highest official COVID-19 death tolls in the world, has seen the number of cases climb over the last few months after easing restrictions in July, when the government first bet on vaccines to protect the public.

From one end of the supply chain to the other, the UK’s food producers have endured a summer of trouble. Iain Brown, vice chairman of East Scotland Growers (ESG) explained “The cold stores didn’t have enough space to hold our crops, so we had to throw away a week’s worth of production,”. And we’ve not had enough workers to harvest our vegetable crops, meaning they are going to waste.” While food shortages have been common in many countries over the course of the pandemic, Brown believes that one issue unique to the UK is making life extra painful by Brexit.

The TUC says the UK needs to be better prepared for future economic shocks. “The Covid is not going to stay the same,” union general secretary Frances O’Grady told his annual conference on Monday. “Climate chaos is already here, and the longer we put off coming to net zero, the more disruptive it will be,” he added. At the same time, the CBI is urging the government to avoid a post-epidemic tax hike on business. In a speech on Monday, CBI Director General Tony Tanker said ministers should make “big choices” to help business investment. Instead, he says, there is a risk that the government will use business taxes to “carry the burden” following the announcement of new taxes last week to fund social security. Not without consequences for such policy development, he would add.

On the other hand dollar started the big economic data on a solid foundation within a week, and investors began to pull away from the super-supportive policy, even as cases of the corona virus increased, as the Federal Reserve was cautious. The greenback ended its high on Friday, it benefited from both the security outflows and the yield-raising policy outlook in the US treasury. Reopening faces challenges from the consumer, who is alert. US consumer price data on Tuesday are expected to cut key inflation to 4.2%.

GBP/USD 4 Hour Chart:

Support: 1.3807 (S1), 1.3784 (S2), 1.3744 (S3).

Resistance: 1.3870 (R1), 1.3910 (R2), 1.3933 (R3).

Amidst this above catalysts the cable pair is on downtrend. We expect a bearish trend for GBP/USD.

BTC/USD Weekly Forecast (13th September 2021 – 17th September 2021)

Fundamental view:

Bitcoin fell against the greenback this week.  The dip saw Bitcoin’s price drop from above $52k to trade below the $45k region earlier this week. The reasons behind the US dollar support are concerns over the delta virus and the Fed officials plan on tapering the bond purchases.  But the Popular cryptocurrency analyst Michael van de Poppe revealed in his latest YouTube session that the cryptocurrency market is not in a bear trend.

On the other hand, Billionaire hedge fund manager Leon Cooperman says if you don’t understand Bitcoin, it means that you’re old. In an interview with CNBC, Cooperman, who is at the helm of Omega Advisors, went on to reveal that at 78 years old, he doesn’t get Bitcoin. As a result, his advice is to be “very careful” with the leading cryptocurrency and if you’re looking for a store-of-value (SOV) asset in an uncertain economy, go with gold.

The major economic events deciding the movement of the pair in the next week are Federal Budget Balance at Sep 13, EIA Crude Oil Stocks Change at Sep 15, Retail Sales monthly report, Initial Jobless Claims at Sep 16 and Michigan Consumer Sentiment at Sep 17 for US.

BTC/USD Weekly outlook:

Technical View:

Last week’s high was 3.52% higher than the previous week. Maintaining high at 52836.0 and low at 42794.6 showed a movement of 10041 pips.

In the upcoming week we expect BTC/USD to show a bearish trend. The Instrument is trading below the 200 Simple Moving Average and the MACD trades to the downside. A solid breakout below 41089.4 may open a clean path towards 36921.3 and may take a way down to 31047.9. Should 51130.8 prove to be unreliable resistance, the BTCUSD may raise upwards 57004.2 and 61172.3 respectively. In H4 chart pennant pattern breakout favors prospects of a bearish trend. Bearish harami pattern constructs a bearish outlook for the pair in the upcoming week.

Preference
Sell: 45137.8 target at 37962.5 and stop loss at 51135.6


Alternate Scenario
Buy: 51135.6 target at 60172.3 and stop loss at 45137.8

XAU/USD Weekly Forecast (13th September 2021 – 17th September 2021)

Fundamental view:

Gold traded low against the greenback during the course of the week. Fed speakers throughout the week have referred to the start of the bond tapering assets. St. Louis Fed James Bullard and New York’s Fed John Williams both agreed that the reduction of the QE will begin later in this year whereas Atlanta’s Fed Raphael Bostic commented that it will be appropriate to reduce the bond purchasing program sometime this year and added that he sees the economy in a reasonably strong position.

All the Fed officials’ speech helped the pair this week. On Friday Mester said that she sees upside risks to the inflation forecasts and that she would be comfortable winding down the stimulus in the first half of 2022.              

The major economic events deciding the movement of the pair in the next week are Federal Budget Balance at Sep 13, EIA Crude Oil Stocks Change at Sep 15, Retail Sales monthly report, Initial Jobless Claims at Sep 16 and Michigan Consumer Sentiment at Sep 17 for US.

XAU/USD Weekly outlook:

Technical View:

Last week’s high was 0.20% lower than the previous week. Maintaining high at 1830.2 and low at 1782.4 showed a movement of 478 pips.

In the upcoming week we expect XAU/USD to show a bullish trend.  The Instrument is trading below the 200 Simple Moving Average and the MACD trades to the upside. A solid breakout above 1817.8 may open a clean path towards 1847.9 and may take a way up to 1865.7. Should 1770.0 prove to be unreliable support, the XAUUSD may sink downwards 1752.2 and 1722.1 respectively. In H4 chart cup and handle pattern formation favors prospects of a bullish trend. Also to be noted Bullish engulfing formation exerts the expectation of uptrend for the pair.

Preference
Buy: 1788.7 target at 1816.9 and stop loss at 1765.4


Alternate Scenario
Sell: 1765.4 target at 1723.6 and stop loss at 1788.7