Use of Currency Correlation in trading

In Forex trading, Correlations play a major role in trade. Forex trading happens from international currencies from various countries and the Currencies are issued by central banks. The value of a currency has a direct impact on an economy, a country’s outlook, commodities, stock markets and people’s spending behavior. At the same time, currencies are affected by various factors such as inflation, interest rates, employment and so on.

In this article, We will explain what are correlations and how to use them and what to pay particular attention on.

Correlation in forex trading?

A foreign exchange correlation is the connection between two currency pairs. There is a positive correlation when two pairs move in the same direction, a negative correlation when they move in opposite directions, and no correlation if the pairs move randomly with no detectable relationship. A negative correlation can also be called an inverse correlation.

Currency correlation is important for traders to understand because it can have a direct impact on forex trading results, often without the trader’s awareness.

As an example, assume that a trader buys two different currency pairs that are negatively correlated. The gains in one may be offset by losses in the other, which is often used as a hedging strategy. Meanwhile, buying two correlated pairs may double the risk and profit potential, since both trades will result in a loss or profit. They are not fully independent since the pairs move in the same direction.

Correlation coefficient

Correlation, in the financial world, is the statistical measure of the relationship between two securities. The correlation coefficient ranges between -1.0 and +1.0. A correlation of +1 implies that the two currency pairs will move in the same direction 100% of the time. A correlation of -1 implies the two currency pairs will move in the opposite direction 100% of the time. A correlation of zero implies that the relationship between the currency pairs is completely random.

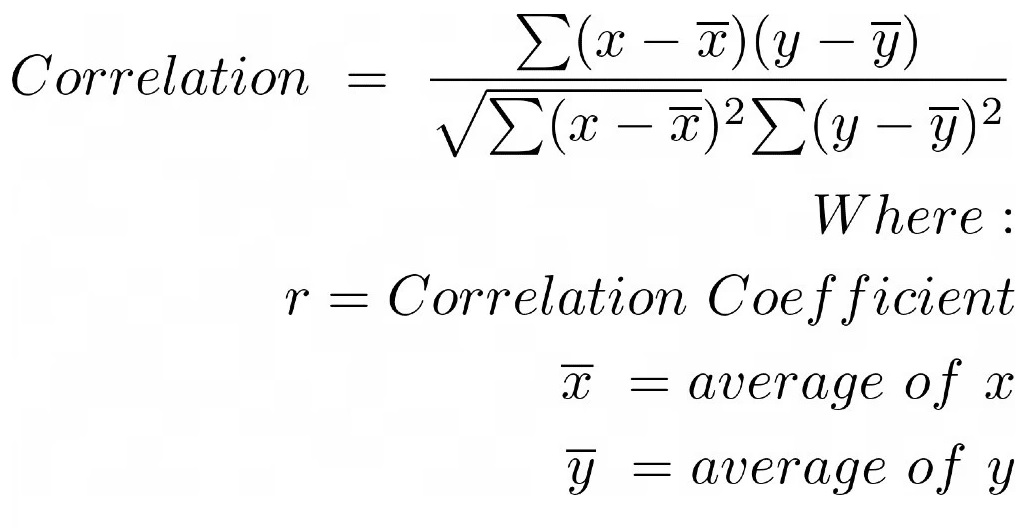
The Pearson correlation coefficient is the most used measure of currency correlations in the forex market, but others include the intraclass correlation and the rank correlation. In the context of currency correlations, the Pearson correlation coefficient is a measure of the strength of a linear relationship between two different forex pairs. Many traders will use a spreadsheet computer program to calculate the Pearson correlation coefficient, because the method for doing so manually is very complex.

How some traders magnify their risk exposure without knowing it

We know that most of the experts and experienced traders advise us not to risk more than 5% of trading capital on a single trade. This makes sense, however considering the things we discussed above, it seems traders might take on more risk than they realize. In order to get a better understanding of the currency correlation meaning, it can be helpful to turn to some practical examples.

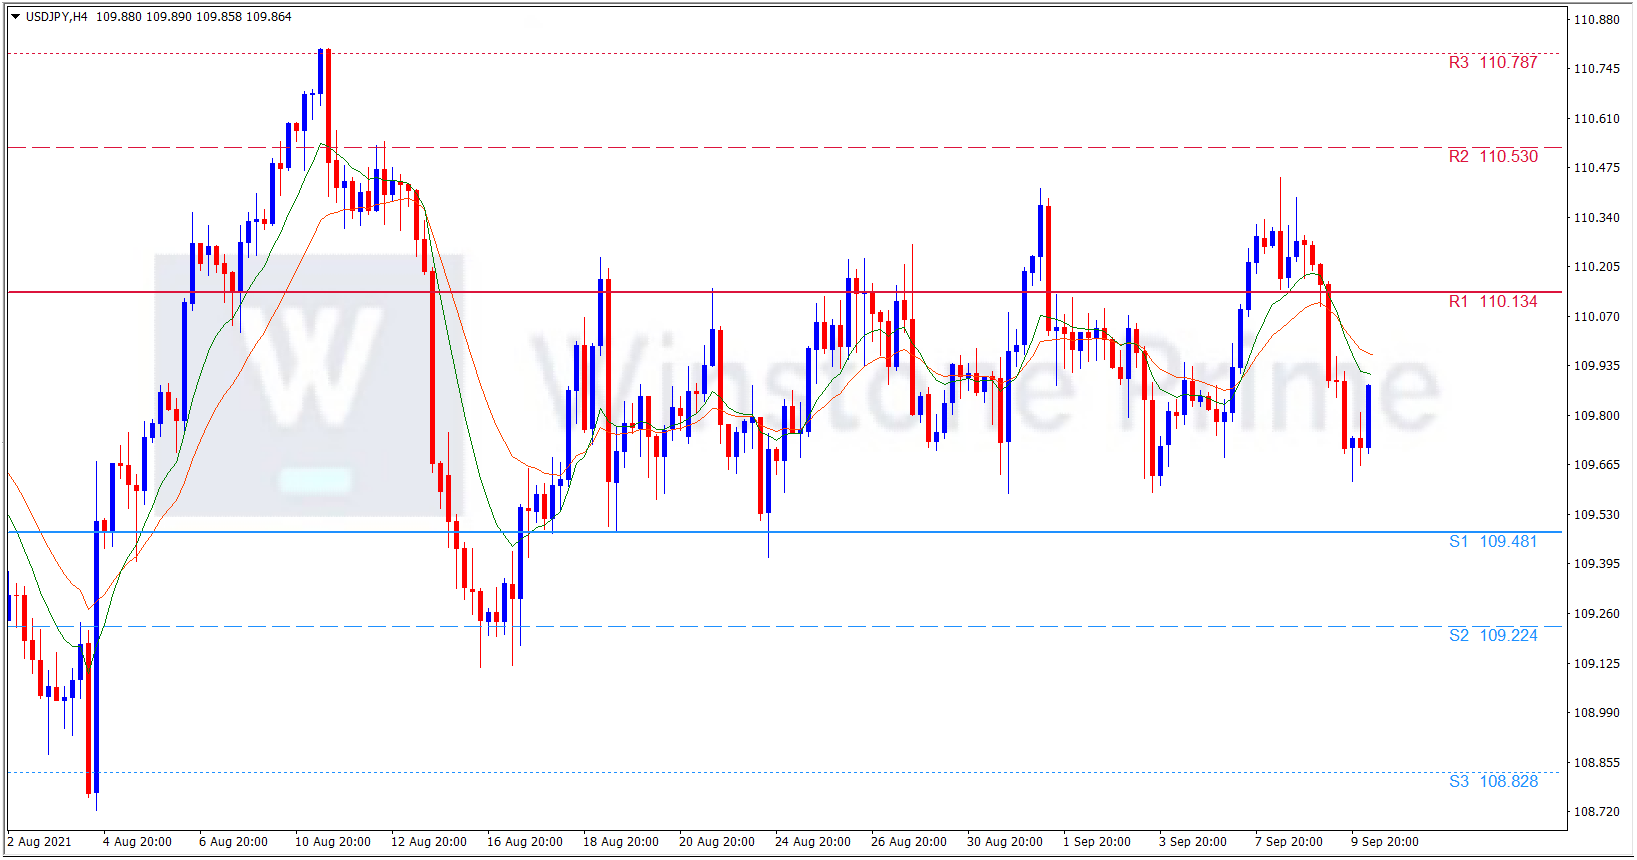
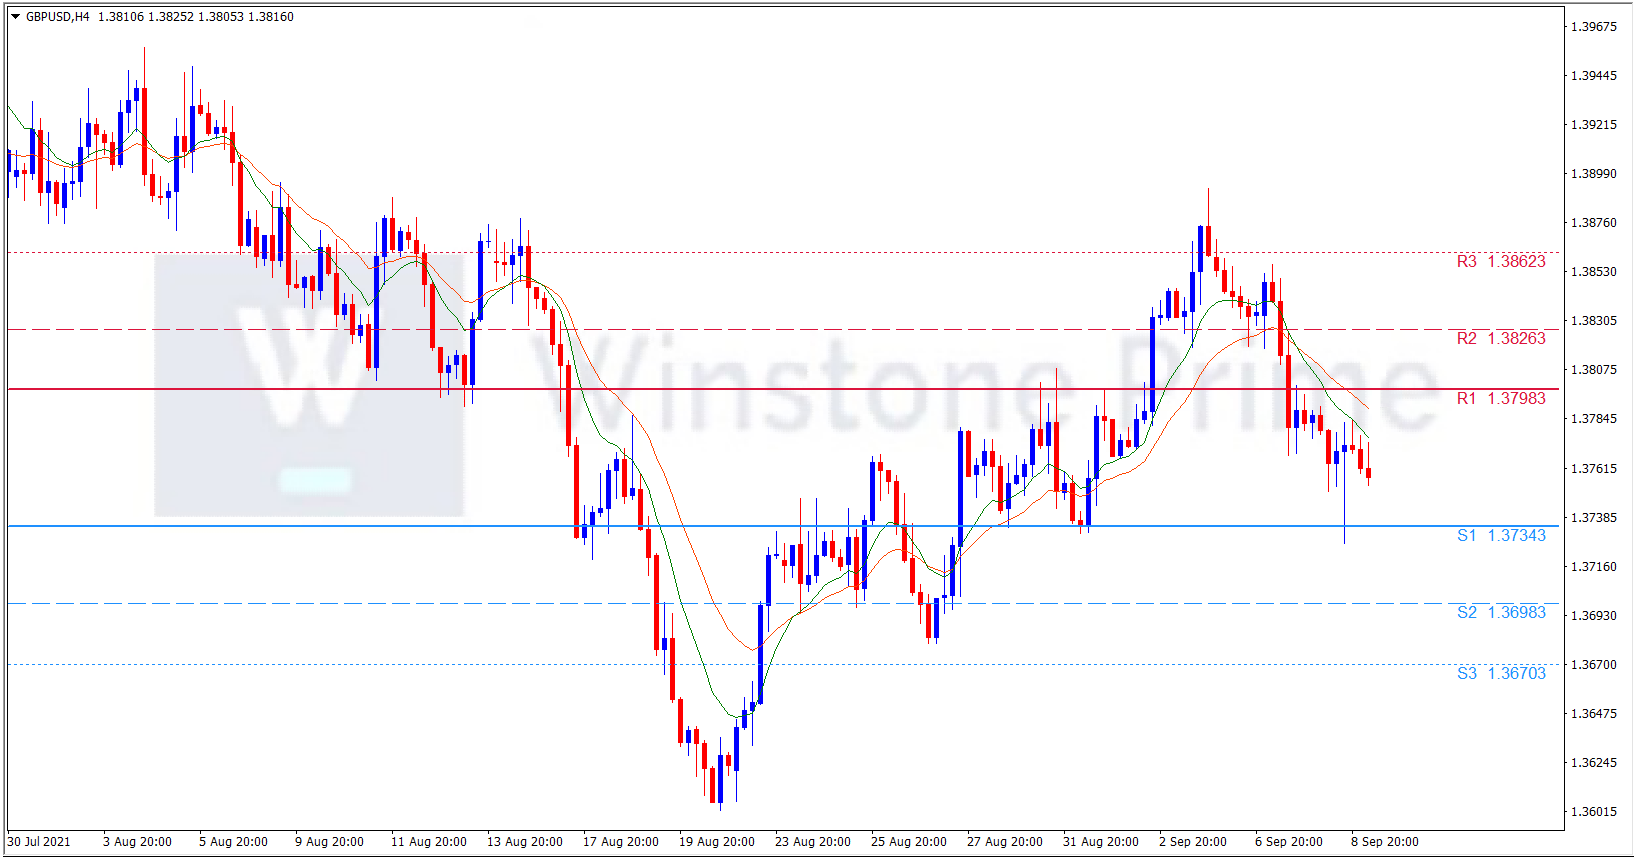
Let us suppose that the trader has $10,000 on a trading account. He or she takes the advice of professionals in the field and only risks $500 (5% of the Funds) in every single trade. So the trader has opened long EUR/USD, GBP/USD, and short USD/JPY positions. If one has no idea what a currency correlation is, then at first glance, this might seem like a well-diversified trading portfolio, with reasonable risk management. However, this line of reasoning ignores the dynamics of currency correlation. As mentioned before the coefficient for EUR/USD and GBP/USD is 0.94, at the same time both of those pairs USD/JPY have a very strong negative correlation between -0.87 and -0.92.

Essentially those three positions very often move towards the same direction. So instead of only risking 5% of the funds, in real terms, the trader risks 15% of the account and if things go wrong, the losses can be considerable. This is something to keep in mind, before opening several positions.

Positively correlated pairs can also be utilized in a different way. For example, a day trader might be looking for an opportunity to open a position with the AUD/USD pair. However, the economic data might be contradictory and there are no clear technical indicators. So it is very uncertain in which direction the market will go. In this case, he or she can take a look at the latest correlation data and take a look at those currency pairs and commodities, which have a high coefficient with AUD/USD. Therefore, looking at GBP/USD or Gold price might be more informative during this process of decision making.

How currency correlate with others?

  • With other currencies. Currencies can correlate with each other, as in our example. We will observe the correlation of two currency pairs, which include one common quoted currency.
  • With indices. This should be clear too. Changes in indices lead to changes in a particular currency. For example, we can recall that the US dollar correlates well with the S&P500 index.
  • With commodity assets. Commodity assets include everything that countries export and import. These are oil, gold, coal, aluminum, etc. You have probably deduced that there is a strong correlation between the Canadian dollar and oil. A correlation is also observed between the Australian dollar and gold.


Conclusion

Typically, correlation is used to confirm the correctness of the analysis. You can observe the behavior of a particular currency pair and, based on it, draw a conclusion regarding the currency pair correlating with it. The more trades move in the same direction, the higher the likelihood of establishing a new trend, which means that the chances of a successful trade also increase. This way you get additional confidence regarding simultaneous trades.

Correlation double both your profit and your loss. Let’s consider an example of a positive correlation. For example, you risk 5% of your deposit and open trades in the positively correlating pairs EUR/USD and EUR/GPB. In this case, the total risk for these two trades will not be 5%, but rather 10%. However, the amount of profit will also double.

Open account now and trade to explore the correlation impact in trading.

ECB bond purchase pressurises dollar

The US dollar has depreciated since yesterday after a weekly jobless claims report and due to European central bank bond purchases. Last Friday, it sank to the lowest since Aug.3 when the US economy created the lowest level in seven months, reducing the chances of an immediate cut in the central bank’s asset-purchase program. Since then, several officials have volunteered to recommend a tape this year, including central bank governor Michelle Bowman, who said overnight that the week August labor report would not leave the central bank’s course.

Data on Thursday showed that the number of Americans filing weekly unemployment claims fell to an 18-month low, dispelling fears of a slower economic recovery, but raising concerns that the federation may move faster than expected to measure its accommodating policies. The Department of Labor said initial demands for state unemployment benefits fell to 35,000 for the week ending Sept. 4, the lowest level since mid-March 2020. It suggested that job growth could be hampered by labor shortages rather than cooling demand for workers.

Treasury Secretary Janet Yellen told U.S. financial regulators on Thursday that there could be “financial stability impacts” if Congress fails to meet the country’s debt ceiling. The Treasury Department said in a statement that the fall was due to the failure to raise the “timely manner” limit on topics raised at a private meeting of the Financial Stability Oversight Council. Yellen campaigned for congressional action and warned that the Treasury would reach the borrowing limit next month.

The Council of Regulators, including the heads of the Federal Reserve, the Securities and Exchange Commission and the Office of the Currency Controller, is leading the risk of causing another financial crisis. The panel discussed the commercial real estate market and listened to a presentation from the Federal Reserve Bank of New York on business trends and “potential risks to various real estate and business risks”. At the behest of President Joe Biden, the Council is also working on a report assessing how the upcoming climate change in November could shake the financial system.

In Japan, when asked about the proposal of Sanae Takaichi, who is running for the leadership of the ruling party commented thay the primary budget-balance target should be set aside until 2% inflation is completed. Finance Minister Taro Aso said on Friday that Japan should not target its public funds for testing “loose monetary policy” such as “modern monetary policy”.

The euro was supported after the European Central Bank said it would reduce emergency bond purchases in the coming quarter. That forecast path indicates that the ECB will withdraw the stimulus very cautiously and that the interest rate hike is far from over. The coming months will focus on how to deal with the expected outcome of the PEPP in the coming months (a temporary, epidemiological facility). An abrupt end would cause a sudden tightening of monetary conditions and undermining growth and inflation expectations,”ANZ Bank analysts explained.

Overall, the market was more limited than the Fed this month, wondering when the Fed will measure the massive measures taken last year to protect the economy from the corona virus pandemic. Meanwhile, the greenback was put on the pressure over European Central Bank, which recovered during the US period before the Treasury yield fell after the US government saw strong demand for the sale of 30-year bonds. The Treasury completed $ 120 billion in coupon-bearing deliveries scheduled for this week.

USD/JPY 4 Hour Chart:

Support: 109.48 (S1), 109.22 (S2), 108.83 (S3).

Resistance: 110.13 (R1), 110.53 (R2), 110.79 (R3).

Amidst this above catalysts the US dollar is under pressure. We expect a bearish trend for USD/JPY.

Brexit woes impact cable

The cable has shown a sideway trend and the market followed strengthening U.S. dollar, among other factors. The pound moved with a lack of direction at the start of September, though it will probably fall on the UK political and economic trends from mid-September onwards. 

Britain is on course to lose its status as one of Germany’s top 10 trading partners this year for the first time since 1950, as Brexit-related trade barriers drive firms in Europe’s largest economy to look for business elsewhere. The UK is expected to drop out of the list of Germany’s top 10 trading partners by the end of this year, official German statistics suggest. Germans spent £13.8bn, or nearly 11%, less on British goods in the first six months of 2021, according to data from the Federal Statistics Office.

U.S. Treasury Secretary Janet Yellen called on Congress to raise the debt limit, warning that the Treasury Department is on track to run out of cash and exhaust its “extraordinary” measures in October. From the reuters report “Risk sentiment did get a small boost after influential New York Fed Bank President John Williams said late on Wednesday that more progress is needed in the labour market before reducing its stimulus. Yet, his comments were hardly a surprise to anyone after surprisingly soft U.S. payroll figures published on Friday have effectively ruled out any chance of the Fed’s tapering this month.

On Wednesday, the US, Germany and the UK also marked an increase in daily covid cases. “There is the covid situation and the shortage of EU workers as a result of Brexit, for example. These factors led to a labor shortage and logistical chaos in the UK this summer.” “This is not a problem for the UK alone, but there are concerns about the rapid spread of Covid-19 among young people. This is apparently due to the slow pace of vaccinations among young people, but there are concerns that schools could become a hotbed for infections when lessons resume.”

Meanwhile dollar was supported by cautious risk sentiment stemming in part from worries about the Delta variant while the euro looked to the European Central Bank policy decision later in the day. The dollar index has risen for the third consecutive day on Wednesday as U.S. stocks stepped back with their high valuation undermined by doubts about the strength of the economic recovery

The doubts over US President Joe Biden’s six-pronged strategy, up for publishing on Thursday, joins the US diplomat’s mixed view on Jerome Powell’s reappointment as the Fed Chairman to also weigh on the sentiment. Further, signals from Republicans and some of the Democratic Party members to offer a bumpy road to the US stimulus also spoiled the mood.

GBP/USD 4 Hour Chart:

Support: 1.3734 (S1), 1.3698 (S2), 1.3670 (S3).

Resistance: 1.3798 (R1), 1.3826 (R2), 1.3862 (R3).

Amidst this above catalysts cable pair seems sideways in the market. We expect a mid-trend on today.

What is an Automated Market Maker?

Cryptocurrency was born on the idea of decentralization; the idea that there should be no middleman in between two parties exchanging assets in a trustless manner. Instead of relying on the traditional buyers and sellers in a financial market, AMMs keep the DeFi ecosystem liquid 24/7 via liquidity pools.

Automated Market Makers (AMMs) are entrants to the crypto exchange development space that appear to be in their infancy, with numerous restrictions. However, they are bringing important advancements to the market. Let’s take a closer look at the What is an “Automated Market Maker (AMM)”.

Market making is the process of providing liquidity to a market by quoting prices at the same time as buying and selling an asset. When a user wants to buy a financial asset that says cryptocurrency like Bitcoin, they must first access the cryptocurrency exchange – where buyers and sellers meet.

A regular centralized cryptocurrency exchange connects buyers with an order book and order matching system with related vendors. The order book is a dynamic, real-time electronic record that maintains and displays all orders to buy or sell cryptocurrency at different prices at any time. The order matching system is a specialized software protocol that matches and resolves orders recorded in the order book. Sometimes, if there are a small number of colleagues to trade with, the user will not be able to fill their bitcoin order at the exchange. When this happens, we say, “Bitcoin market is illiquid.”

In this regard, liquidity is an indicator or a measure of the “availability” or the speed at which an asset can be bought or sold without noticeably affecting its price stability. When a market is illiquid, there aren’t enough available assets or traders within that market. It becomes difficult to execute a trade without significantly affecting the asset’s price on that particular exchange.

In order to guarantee liquidity, centralized exchanges employ professional traders – represented by banks, brokerage houses, and a variety of other financial groups – to continuously provide a “bid-ask spread” on the exchange. In other words, these market makers constantly offer to buy and sell an asset at multiple prices so that users will always have someone to trade against. The process of providing liquidity to the exchange is called market making, and the entities that provide this service are called market makers. The role of the market maker is to make financial markets more efficient and reduce asset price volatility by providing stable liquidity to assets.

AMM (Automated Market Maker) is changing the perception of the financial world of the 21st century. This is a completely new innovative product created in the decentralized financial sector (DeFi) and based on decentralized exchanges (DEXs). It is a method that automates digital asset trading without the need for authorization, and trades are executed automatically using liquidity pools to substitute buyers and sellers. It’s a sort of decentralized exchange (DEX) technology in which the price of assets is determined by a mathematical formula. AMMs are created to change the exchange of cryptocurrencies between users. Instead of the usual buying and selling practice, each party that wants to trade will be pre-funded with liquidity pools in the chain. The liquidity pool allows different users to switch tokens on the chain in a completely different way from the normalized and decentralized way that has been practiced previously. Liquidity pools allow users to easily switch between tokens in a fully decentralized and non-custodial way. Meanwhile, liquidity providers receive passive income from trading commissions, which depend on their share in the pool.

The AMM is built on a transaction method that uses an algorithm to calculate the price of a token right at the time of purchase. The process itself has no concept of sellers; instead, smart contracts act as an intermediary. The seller places the asset in a place called the liquidity pool, and then the buyer exchanges the assets they already have for the assets in the pool via a smart contract.

  • The first main feature of an AMM is that it sets a single price for the exchange between 2 digital assets.
  • The price set is known and therefore consistently visible to all exchange participants.
  • AMMs do not hold equity to facilitate trades but store it from third parties, considered to be participating in this consensus.


The capital thus received is stored in liquidity pools, and those who contribute to maintaining these pools receive a percentage of the trading fees charged by an AMM.

Best AMM’s in DeFi

The top DeFi Protocols, which operate as the greatest Automated Market Makers in the bitcoin world, are listed below.

Uniswap

Uniswap is a decentralized open-source protocol that was introduced in November 2018 as the first Decentralized AMM. It delivers immediate, automatic liquidity without depending on any order book. This protocol makes use of liquidity providers who put ERC 20 tokens into pools to help traders. The mathematical equation that determines the ratios of the tokens kept in the pool is used by Uniswap to keep the market steady.

Curve

Curve, an open-source DeFi Protocol that was introduced in January 2020, seeks to offer liquidity for stable cryptocurrencies by acting as a Decentralized Exchange (DEX).  Individuals and smart contracts can utilize this, and these curve protocols include a native governance token called CRV.

PANCAKESWAP

PancakeSwap was launched in September 2020 and is a decentralized exchange for swapping BEP20 tokens on Binance Smart Chain and offers much lower trading fees. Like many other DEXs, PancakeSwap is built on an automated market maker (AMM) system, which relies on user-fueled liquidity pools to enable crypto trades. Such pools are filled with user’s funds. They deposit them into the pool, receiving liquidity provider (or LP) tokens or FLIP tokens in return. They can use those tokens to reclaim their share, plus a portion of the trading fees. PancakeSwap also allows users to farm additional tokens – CAKE and SYRUP. On the farm, users can deposit LP tokens, locking them up in a process that rewards users with CAKE. Users can stake CAKE tokens to receive SYRUP, which will have further functionality as governance tokens.

Conclusion

From the above explanation it is clear that crypto market makers work 24 hours a day to reduce price volatility by providing adequate amount of liquidity. Automated market makers are the powerhouse behind decentralized finance. They enable anyone to make markets and seamlessly trade cryptocurrency in a highly secure, non-custodial, and decentralized manner. Unlike centralized exchanges, decentralized trading protocols eliminate order books, order matching systems, and financial institutions that act as market makers: some examples are Uniswap, Sushi, Curve, and Balancer. The goal is to remove third-party input so that users can trade directly from their personal wallet. Therefore, most processes are implemented and managed by smart contracts. AMMs allow traders to engage with planned smart deals to enable liquidity and price detection.