BTC/USD Weekly Forecast (06th September 2021 – 10th September 2021)

Fundamental view:

Bitcoin showed an uptrend against the US dollar in the last week. Amidst the US dollar weakness supporting the big crypto, Bitcoin adoption also seems to be going well despite the May 19 crash or the choppy markets that followed it. Many countries are warming up to BTC in one way or another, which has given rise to two factions, the supporters and the ones that stay away from cryptocurrencies altogether.

Twitter supports the Bitcoin. Twitter’s latest beta update reportedly included a tipping feature that allows users to tip BTC. Dorsey confirmed the reports by agreeing that Twitter might use African partners for this purpose as a milestone for the future. Similarly, The Belarusian President, Alexander Lukashenko, has called on the government to mine BTC during a speech at the Petrikovsky mining and processing plant on August 27.

The major economic events deciding the movement of the pair in the next week are JOLTS Job Openings, FOMC Member Williams Speech at Sep 08, Initial Jobless Claims, EIA Crude Oil Stocks Change at Sep 09 and WASDE Report at Sep 10 for US.

BTC/USD Weekly outlook:

Technical View:

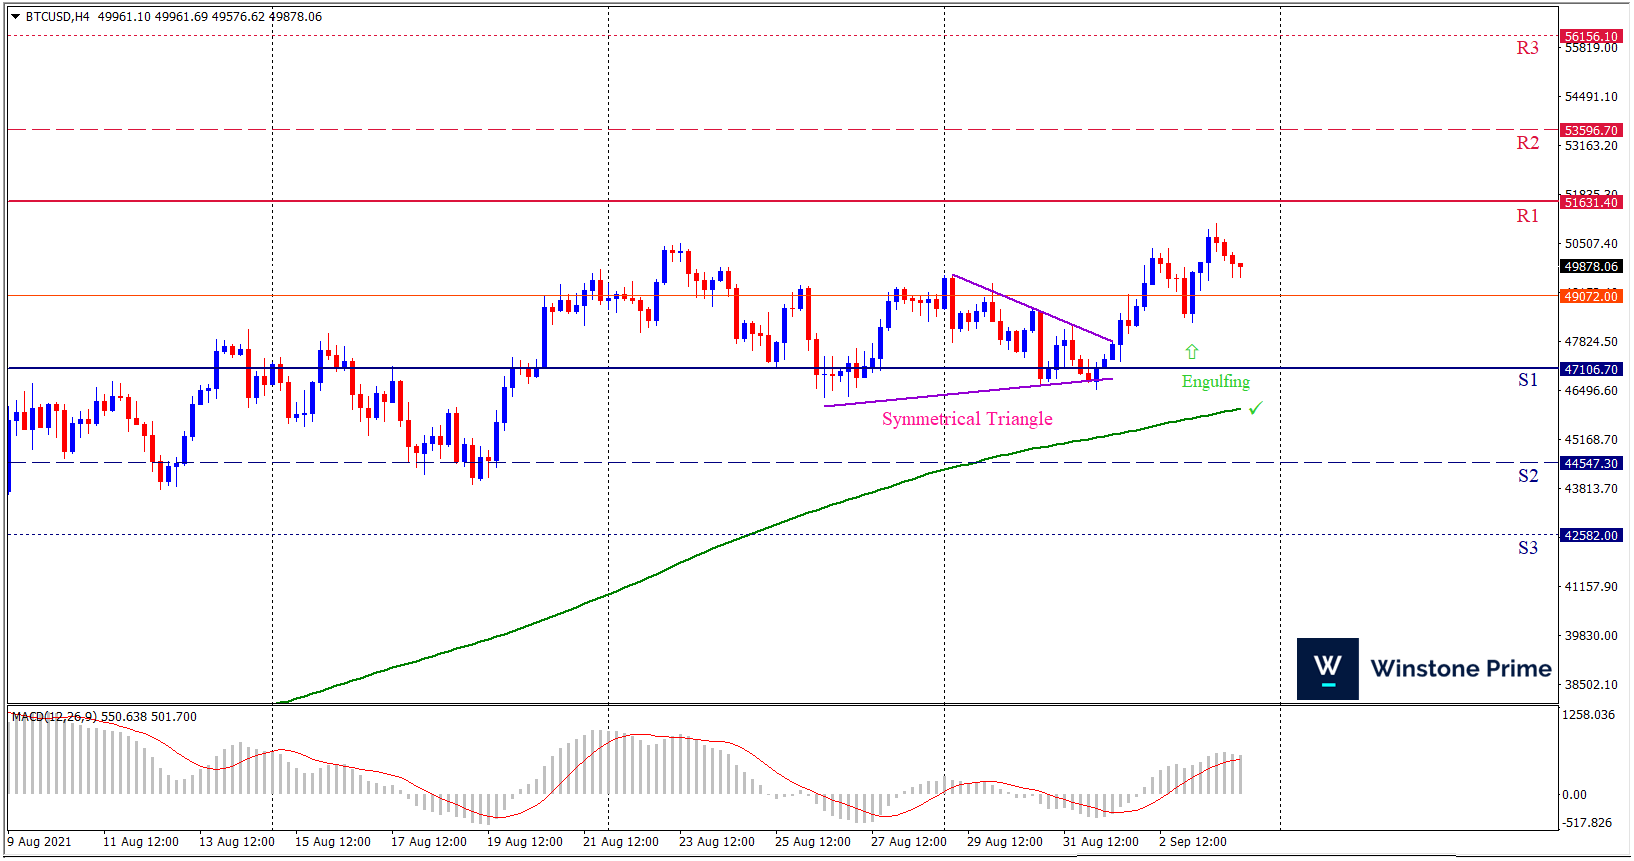
Last week’s high was 1.05% higher than the previous week. Maintaining high at 51037.2 and low at 46512.5 showed a movement of 4524 pips.

In the upcoming week we expect BTC/USD to show a bullish trend. The Instrument is trading above the 200 Simple Moving Average and the MACD trades to the upside. A solid breakout above 51631.4 may open a clean path towards 53596.7 and may take a way up to 56156.1. Should 47106.7 prove to be unreliable support, the BTCUSD may sink downwards 44547.3 and 42582.0 respectively. In H4 chart symmetrical triangle breakout favors prospects of a bullish trend. Bullish engulfing pattern constructs a bullish outlook for the pair in the upcoming week.

Preference
Buy: 49885.8 target at 53595.7 and stop loss at 47101.6


Alternate Scenario
Sell: 47101.6 target at 42583.3 and stop loss at 49885.8

XAU/USD Weekly Forecast (06th September 2021 – 10th September 2021)

Fundamental view:

Gold formed a bullish candle against the greenback in the past week. The dramatic shift in monetary policy forecasts, supporting gold prices, comes after the U.S. Labor Department said that only 235,000 jobs were created in August. The data significantly missed expectations as economists were forecasting jobs gains of 720,000. The jobs gains were well below even the most bearish estimates. Whereas In August, layoffs fell to their lowest level in more than 24 years, with the number of Americans filing new demands for unemployment benefits falling last week, claiming that the labor market is charging even as the new Covid-19 pandemic escalates.

This week John Paulson, president and portfolio manager at Paulson & Co and Mark Mobius, founder of Mobius Capital Partners, both made headlines for bullish calls on the precious metal. Monday, in an interview with Bloomberg’s David Rubenstein, Paulson said that he prefers gold over bitcoin and that the precious metal looks attractive in the current inflationary environment. “Gold does very well in times of inflation,” he said. Paulson added that gold can go “parabolic” because it is relatively small compared to the overall financial market. Amidst all these catalysts, Yellow metal showed a bullish trend.              

The major economic events deciding the movement of the pair in the next week are JOLTS Job Openings, FOMC Member Williams Speech at Sep 08, Initial Jobless Claims, EIA Crude Oil Stocks Change at Sep 09 and WASDE Report at Sep 10 for US.

XAU/USD Weekly outlook:

Technical View:

Last week’s high was 0.81% higher than the previous week. Maintaining high at 1833.9 and low at 1801.7 showed a movement of 322 pips.

In the upcoming week we expect XAU/USD to show a bullish trend.  The Instrument is trading above the 200 Simple Moving Average and the MACD trades to the upside. A solid breakout above 1840.2 may open a clean path towards 1853.2 and may take a way up to 1872.4. Should 1808.0 prove to be unreliable support, the XAUUSD may sink downwards 1788.8 and 1775.8 respectively. In H4 chart rectangle pattern breakout favors prospects of a bullish trend. Also to be noted Bullish engulfing formation exerts the expectation of uptrend for the pair.

Preference
Buy: 1827.5 target at 1852.4 and stop loss at 1803.7


Alternate Scenario
Sell: 1803.7 target at 1776.8 and stop loss at 1827.5

AUD/USD Weekly Forecast (06th September 2021 – 10th September 2021)

Fundamental view:

Aussie showed an uptrend against the US dollar. The pair benefited from the broad dollar’s weakness because the investors sold the greenback on speculation the US Federal Reserve will have to put tapering in the hold for now, amid the slow recovery of the employment sector. The US August Nonfarm Payrolls report came in somewhat mixed, but the headline figure was quite disappointing, as the country added just 235K new jobs in the month vs. the 750K expected. Whereas Fed Powell expressed concerns about the potential effects of the spread of the coronavirus Delta variant in the economic recovery. Meanwhile, Australian figures released in the last few days were more encouraging than anticipated.

Australia Home Loans monthly report on 2nd September and US Nonfarm Payrolls on 3rd September created downtrend whereas Australia Current Account on 31st August and Australia GDP quarterly report on 1st September created uptrend for the pair.

The major economic events deciding the movement of the pair in the next week are RBA Interest Rate Decision at Sep 07, RBA Deputy Governor Debelle Speech, US JOLTS Job Openings, FOMC Member Williams Speech at Sep 08, US Initial Jobless Claims, US EIA Crude Oil Stocks Change at Sep 09 and US WASDE Report at Sep 10.

AUD/USD Weekly outlook:

Technical View:

Last week’s high was 2.20% higher than the previous week. Maintaining high at 0.7478 and low at 0.7284 showed a movement of 194 pips.

In the upcoming week we expect AUD/USD to show a bullish trend.  The currency pair is trading above the 200 Simple Moving Average and the MACD trades to the upside. A solid breakout above 0.7524 may open a clean path towards 0.7598 and may take a way up to 0.7718. Should 0.7330 prove to be unreliable support, the AUDUSD may sink downwards 0.7210 and 0.7136 respectively. In H4 chart ascending scallop pattern favors prospects of a bullish trend. Also to be noted three outside up formation exerts the expectation of uptrend for the pair.

Preference
Buy: 0.7451 target at 0.7597 and stop loss at 0.7325


Alternate Scenario
Sell: 0.7325 target at 0.7137 and stop loss at 0.7451

USD/JPY Weekly Forecast (06th September 2021 – 10th September 2021)

Fundamental view:

Greenback fell against the Japanese yen in the past week. The main reason behind the dollar fell are the renewed USD weakness following the Dovish Fed Officials comments and the dismal US August jobs report. Nonfarm Payrolls in US increased by only 235,000 in August which fell well short of already-lowered projections. Fed Powell expressed concerns about the potential effects of the spread of the coronavirus Delta variant in the economic recovery. He noted that tapering may still happen this year, conditioned on progress in the economy towards the Fed’s goals. About inflation, he said “At these levels, it is, of course, a cause for concern,” but added, “that concern is tempered by a number of factors that suggest that these elevated readings are likely to prove temporary.” Amidst all these catalyst, greenback showed a downtrend.

US S&P/CS HPI Composite-20 s.a. monthly report on 31st August and Japan Markit Services PMI on 3rd September created uptrend whereas Japan Retail Sales monthly report on 30th August and US ADP Nonfarm Employment Change on 1st September created downtrend for the pair.

The major economic events deciding the movement of the pair in the next week are Japan GDP quarterly report at Sep 07, Japan Economy Watchers Index for Current Conditions, US JOLTS Job Openings, FOMC Member Williams Speech at Sep 08, US Initial Jobless Claims, US EIA Crude Oil Stocks Change at Sep 09 and US WASDE Report at Sep 10.

USD/JPY Weekly outlook:

Technical View:

Last week’s high was 0.14% higher than the previous week. Maintaining high at 110.42 and low at 109.59 showed a movement of 83 pips.

In the upcoming week we expect USD/JPY to show a bearish trend. The currency pair is trading below the 200 Simple Moving Average and the MACD trades to the downside. A solid breakout below 109.39 may open a clean path towards 109.08 and may take a way down to 108.56. Should 110.22 prove to be unreliable resistance, the USDJPY may raise upwards 110.74 and 111.05 respectively. In H4 chart, Formation of diamond pattern breakout indicates reversal of the trend creating prospects of a bearish trend Along with a bearish harami formation braces our expectation.

Preference
Sell: 109.72 target at 109.09 and stop loss at 110.25


Alternate Scenario
Buy: 110.25 target at 111.04 and stop loss at 109.72