GBP/USD Weekly Forecast (06th September 2021 – 10th September 2021)

Fundamental view:

Pound closed the week with a bullish candle but did not make out much with the Dollar sell-off. As far the employment report is considered, US Nonfarm Payrolls figures fell well short of already-lowered projections, coming out at only 235,000 positions gained in August. On the other side for pond, Brexit-related shortages on supermarket shelves and also stubbornly high coronavirus cases continued stymieing sterling’s advance. And the infections have drifted somewhat lower. The US is lagging, with only a deceleration in the number of new cases.

US HPI on 31st August and US EIA Crude Oil Stocks Change on 1st September created downtrend whereas US Pending Home Sales monthly report on 30th August and Britain Nationwide HPI yearly report on1st September created uptrend for the pair.

The major economic events deciding the movement of the pair in the next week are UK Markit/CIPS Construction PMI at Sep 06, US JOLTS Job Openings, FOMC Member Williams Speech at Sep 08, US Initial Jobless Claims, US EIA Crude Oil Stocks Change at Sep 09, UK Manufacturing Production monthly report, UK GDP monthly report and US WASDE Report at Sep 10.

GBP/USD Weekly outlook:

Technical View:

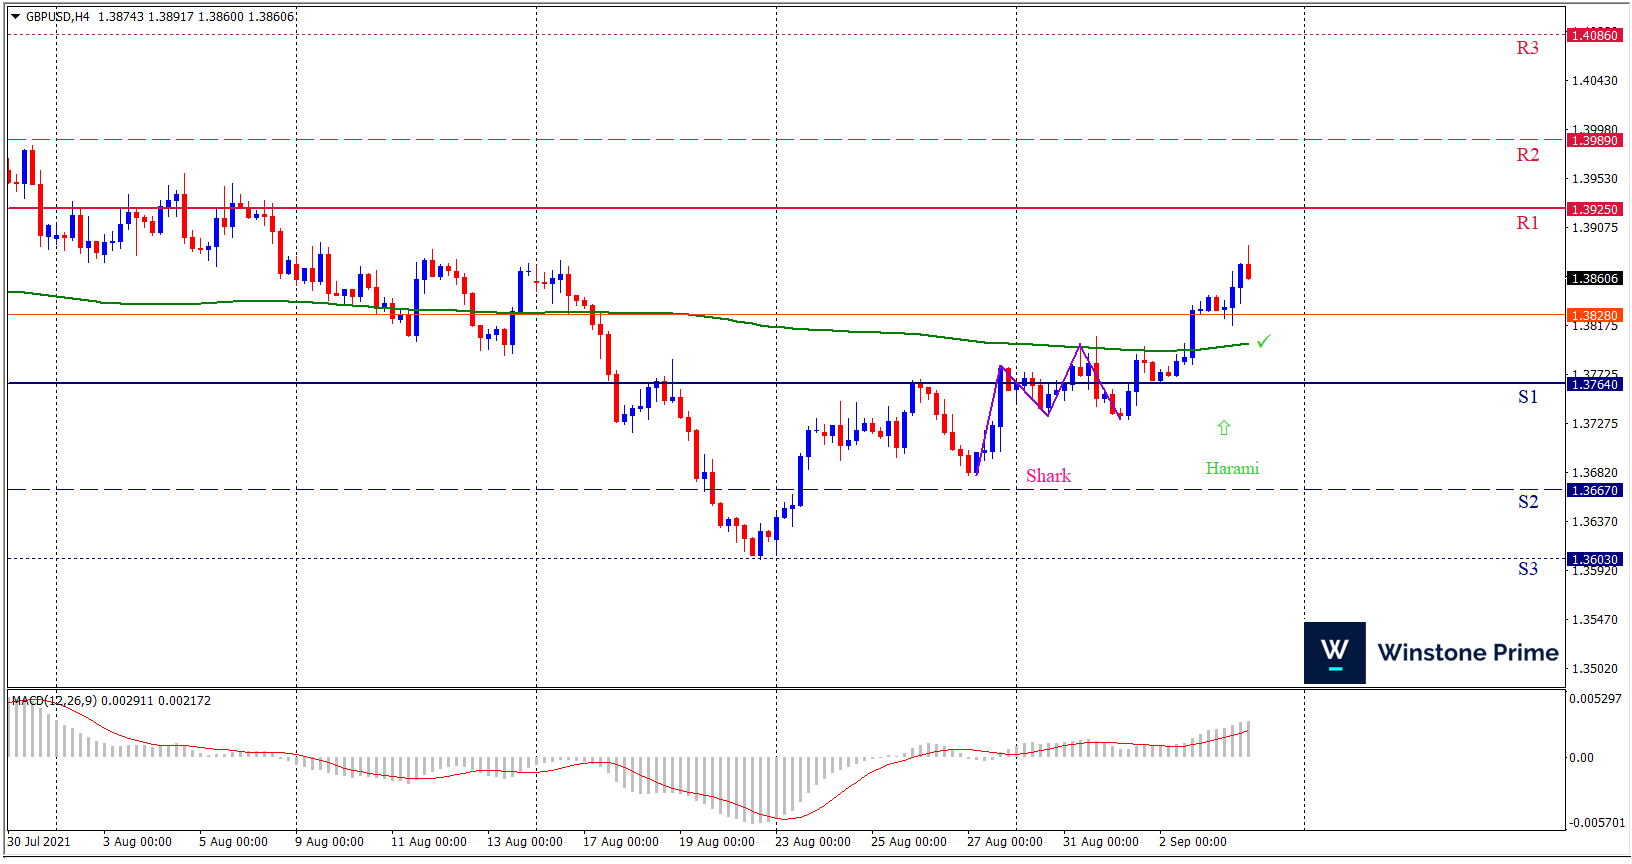
Last week’s high was 0.81% higher than the previous week. Maintaining high at 1.3892 and low at 1.3731 showed a movement of 161 pips.

In the upcoming week we expect GBP/USD to show a bullish trend.  The currency pair is trading above the 200 Simple Moving Average and the MACD trades to the upside. A solid breakout above 1.3925 may open a clean path towards 1.3989 and may take a way up to 1.4086. Should 1.3764 prove to be unreliable support, the GBPUSD may sink downwards 1.3667 and 1.3603 respectively. Chart formation of bullish shark pattern in H4 chart favors prospects of a bullish trend. Harami pattern formation escalates the expectation for a bullish trend.

Preference
Buy: 1.3859 target at 1.3988 and stop loss at 1.3759


Alternate Scenario
Sell: 1.3759 target at 1.3604 and stop loss at 1.3859

EUR/USD Weekly Forecast (06th September 2021 – 10th September 2021)

Fundamental view:

Euro rallied against the greenback in the past week. This is mostly due to the dovish comments from US Federal Reserve Chair Jerome Powell and tepid local employment-related data, all of which points to a delay in tapering. Hawkish which came from different fed officials led to the speculation the US central bank will start reducing its ultra-loose monetary policy by year-end. But Powell cooled down such hopes at the Jackson Hole symposium by expressing concerns about the potential effects of the spread of the coronavirus Delta variant in the economic recovery. Amidst this current scenario where investors are cautious towards the greenback, Euro showed a bullish trend.

Europe Retail Sales yearly report on 30th August and US S&P/CS HPI Composite-20 yearly report on 31st August created downtrend whereas Europe Unemployment Rate on 1st September and Europe PPI monthly report on 2nd September created uptrend for the pair.

The major economic events deciding the movement of the pair in the next week are Europe Employment Change quarterly report, Europe GDP quarterly report at Sep 07, US JOLTS Job Openings, FOMC Member Williams Speech at Sep 08, ECB Interest Rate Decision, US Initial Jobless Claims, US EIA Crude Oil Stocks Change at Sep 09, Eurogroup Meeting and US WASDE Report at Sep 10.

EUR/USD Weekly outlook:

Technical View:

Last week’s high was 0.91% higher than the previous week. Maintaining high at 1.1909 and low at 1.1783 showed a movement of 126 pips.

In the upcoming week we expect EUR/USD to show a bullish trend. The currency pair is trading above the 200 Simple Moving Average and the MACD trades to the upside. A solid breakout above 1.1930 may open a clean path towards 1.1982 and may take a way up to 1.2056. Should 1.1804 prove to be unreliable support, the EURUSD may sink downwards 1.1730 and 1.1678 respectively. Chart formation of a pennant pattern in H4 chart sets prospects for a bullish trend. Engulfing formation in H4 chart escalates the expectation for a bullish trend.

Preference
Buy: 1.1875 target at 1.1981 and stop loss at 1.1799


Alternate Scenario
Sell: 1.1799 target at 1.1679 and stop loss at 1.1875

The important things about Kiwi

The currency of New Zealand is called the New Zealand dollar, sometimes referred to as the “kiwi”. Kiwi is usually connected with New Zealand, and the $1 coin has a kiwi on it. It is the official currency of New Zealand. The coin was minted in 1967 and divided into 100 parts or cents. Prior to 1967, the currency was known as the New Zealand pound. But since it was destroyed, it has been called the New Zealand dollar. Capping off the top 10 of the most traded currencies in the world, the Kiwi is the 10th most traded currency representing approximately 2.1% of the global currency traded. The Reserve Bank of New Zealand manages the NZD currency.

The currency falls in the bottom of the top 10 in part because it is not a major reserve currency, as its use is limited to New Zealand and minor territories.  The currency heavily relies on the balance of trade between New Zealand, and its primary trading partners Australia and China. This trade is composed mainly of agricultural produce, oil, and cars. There are more than $7.32 New Zealand Kiwis in circulation.

In this article we categorized into importance of New Zealand Dollar and How it impacts the Economy in detailed.

History of New Zealand Dollar

  • The New Zealand dollar is a fairly new entrant to the world currency market, as it was only introduced in 1967. The Pound was New Zealand’s currency before the New Zealand Dollar was introduced. Since 1840, the New Zealand pound, with 1 pound = 20 shillings and 1 shilling = 12 pence.
  • In 1957, the New Zealand government set up a group to investigate decimal currency, and in 1963 the government decided to decimalize the New Zealand currency.
  • In 1964, the Decimal Currency Act was approved, and the transition took place on July 10, 1967. On the same date, the New Zealand Dollar was introduced, replacing the Pound at a rate of 2 Dollars = 1 Pound.


Factors Influencing NZD

New-Zealand economy is highly dependent on Commodity prices mainly leading industries including agriculture, dairy, forestry, fishing, mining and tourism. In fact, New Zealand is the world’s largest milk powder exporter, meaning that if milk prices rise, the NZD will most likely benefit. With tourism contributing about 6% to the country’s gross domestic product (GDP), the 2020 global financial crisis is likely to affect its currency as fewer tourists come to New Zealand. But it had recovered once lockdown restrictions eased.

Kiwi relationship with Aussie

Australia is New Zealand’s second largest trading partner after China, accounting for about 14% of New Zealand’s total exports. As a result, the performance of the Australian economy has a significant impact on the New Zealand dollar. 

The NZD/USD and AUD/USD currency pairs have a currency correlation coefficient a statistical measure of the relationship between the two currencies of 0.90. To provide context, a correlation of 1 shows a perfect positive correlation, while a correlation of -1 shows a perfect negative correlation. 

Trends of New Zealand Dollar while crisis time

Shortly before the 2008 global financial crisis, the NZD experienced a major crisis in 2007.The New Zealand dollar sold undeclared amount of up to $ 9 billion USD. This is the first government intervention in monetary policy since 1985. They followed this intervention with two successive steps. These two moves did not have the first success. In 2008 it faced a global financial crisis; The currency collapsed in the wake of the global downturn. Investors fled the currency as it was considered a risky currency at the time. However, by 2009, it had strengthened again and ended that year very strongly. Since then, it has been relatively stable.

The pandemic severely affected the New Zealand economy. In mid-March 2020, the government imposed economic locks on businesses in most countries. Exemption was given only to essential businesses such as supermarkets. However, with the speedy implementation of the rules regarding locking and corona and the restrictions were gradually removed in April, May and June. However, in September, the economy officially entered a recession. The pandemic was due to a 12.2% contraction of the country’s GDP. The severe lockdown and international travel ban imposed at the outset of the epidemic has incredibly severely affected retail, accommodation, hospitality and transportation. After facing the initial problem of Covid and lockdowns, New Zealand was able to control the virus, which led to sharp economic growth. The country ended 2020 with an economic expansion of 0.4% instead of the 1.7% contraction predicted by many economists. The V-shaped recovery led to a fall in unemployment until December 2020, down from a Covid rise of 5.3% in September 2020. Now it has been moved to a far level.

Conclusion

The NZD/USD is its most widely traded pair and the New Zealand dollar is the 10th highest trading currency in the world. New Zealand’s geography also makes it one of the best trading partners for emerging economies in Asia. So traders can use kiwi as a vehicle to showcase economic developments in fast-growing Asian markets like China. Trading the New Zealand dollar is a way of expressing an outlook on market sentiment. As Kiwi is anchored in the business cycle of the world, it allows traders to bet on a relatively liquid asset with broad-based expectations for global growth. Finally, New Zealand has relatively high interest rates compared to most developed countries. Traders can take advantage of this and implement carry-trade strategies against currencies that have a relatively low interest rate, such as the Japanese yen. Commonly traded NZD currency pairs: NZD/USD, AUD/NZD, EUR/NZD, GBP/NZD. NZD/CAD, NZD/CHF, NZD/JPY. Open Winstone Prime Account now and explore the opportunity of trading kiwi.

Weaker dollar favors gold

Yellow metal reached small gains due to weaker dollar meanwhile investors are waiting for U.S. Jobs data to gauge the Federal Reserve’s plans to start tapering asset purchases. The US economy is seen adding 750K jobs in August vs. a 943K addition seen previously. An astounding bull run in local equity markets amid the Covid-19 pandemic has taken the shine off gold and historically one of the most in-demand assets during a crisis.

Yesterday, initial jobless claims and continued claims were eased from the weekly market consensus that ended Aug. 27. The four-week average of Initial Jobless Claims also declined from 366.75K to 355K. Previously, both the ADP job change and the US ISM manufacturing PMI employment component indicated a contraction in US jobs and the need for more flexible monetary policies. Besides, looming Delta covid variant concerns and hopes for more Chinese stimulus continue to put a floor under gold price.

This week John Paulson, president and portfolio manager at Paulson & Co and Mark Mobius, founder of Mobius Capital Partners, both made headlines for bullish calls on the precious metal. Monday, in an interview with Bloomberg’s David Rubenstein, Paulson said that he prefers gold over bitcoin and that the precious metal looks attractive in the current inflationary environment. “Gold does very well in times of inflation,” he said. Paulson added that gold can go “parabolic” because it is relatively small compared to the overall financial market.

On the other hand opportunities for a merger between the ECB and the Federal Reserve are creeping forward and weighing the green back. Inflation concerns continued on Tuesday, with eurozone inflation rising to 3% in August, the highest in a decade and above the European Central Bank’s 2% target, as well as a 2.7% Reuters forecast. This comes after last week when Philip Lane of the ECB spoke at Jackson Hole last week. He basically promised to measure the ECB QE plan upwards and downwards to financial positions. This could favor the Gold purchases.

In August, layoffs fell to their lowest level in more than 24 years, with the number of Americans filing new demands for unemployment benefits falling last week, claiming that the labor market is charging even as the new Covid-19 pandemic escalates. The Department of Labor will release the Non-Farm payrolls Report for August at 1230 GMT. Solid jobs recovery is the import criterion for the US Federal Reserve to initiate pandemic-period triggers. Gold is seen as a safeguard against inflation, which may be the result of massive economic stimulus measures.

Analysts have noted that gold struggles to attract attention. Investors are focusing on the laser in a possible shift in U.S. monetary policy as the Federal Reserve reduces its monthly bond purchases by the end of the year. For many analysts, non-farm reports on Friday will be an important stimulus for gold. Some analysts say weak job growth in August could force the Federal Reserve to delay its tapping plans, which could push the price of gold back to $1,900 an ounce. At the same time however a stronger-than-expected employment report will solidify the Federal Reserve’s plan to push the price of gold to their recent lows.

XAU/USD 4 Hour Chart:

Support: 1803.9 (S1), 1798.4 (S2), 1791.8 (S3).

Resistance: 1816.0 (R1), 1822.6 (R2), 1828.1 (R3).

Amidst these above catalysts yellow metal is on gaining mood and waited for U.S. Jobs data. We expect a bullish trend for XAU/USD.