AUD/USD Weekly Forecast (30th August 2021 – 03rd September 2021)

Fundamental view:

The Australian dollar has rallied a bit against the greenback during the course of the trading week. In US, Fed Chair Jerome Powell’s which was much anticipated speech at the bank’s annual Jackson Hole symposium on Friday disappointed rate hawks hoping for an immediate change in policy which lead to the fall of US dollar. The Fed’s bond purchase program of $120 billion a month of Treasuries and mortgage-backed securities also impacted the US dollar. The reduction of the purchases will permit Treasury rates to rise but the Fed is determined to prevent a rapid increase.

US Core Durable Goods Orders monthly report on 25th August and Australia Private New Capital Expenditure quarterly report on 26th August created downtrend whereas US Markit Composite PMI on 23rd August and US New Home Sales on 24th August created uptrend for the pair.

The major economic events deciding the movement of the pair in the next week are RBA Private Sector Credit monthly report, US CB Consumer Confidence Index at Aug 31, Australia GDP quarterly report, US ADP Nonfarm Employment Change, US ISM Manufacturing PMI at Sep 01, US Initial Jobless Claims at Sep 02 and US Nonfarm Payrolls at Sep 03.

AUD/USD Weekly outlook:

Technical View:

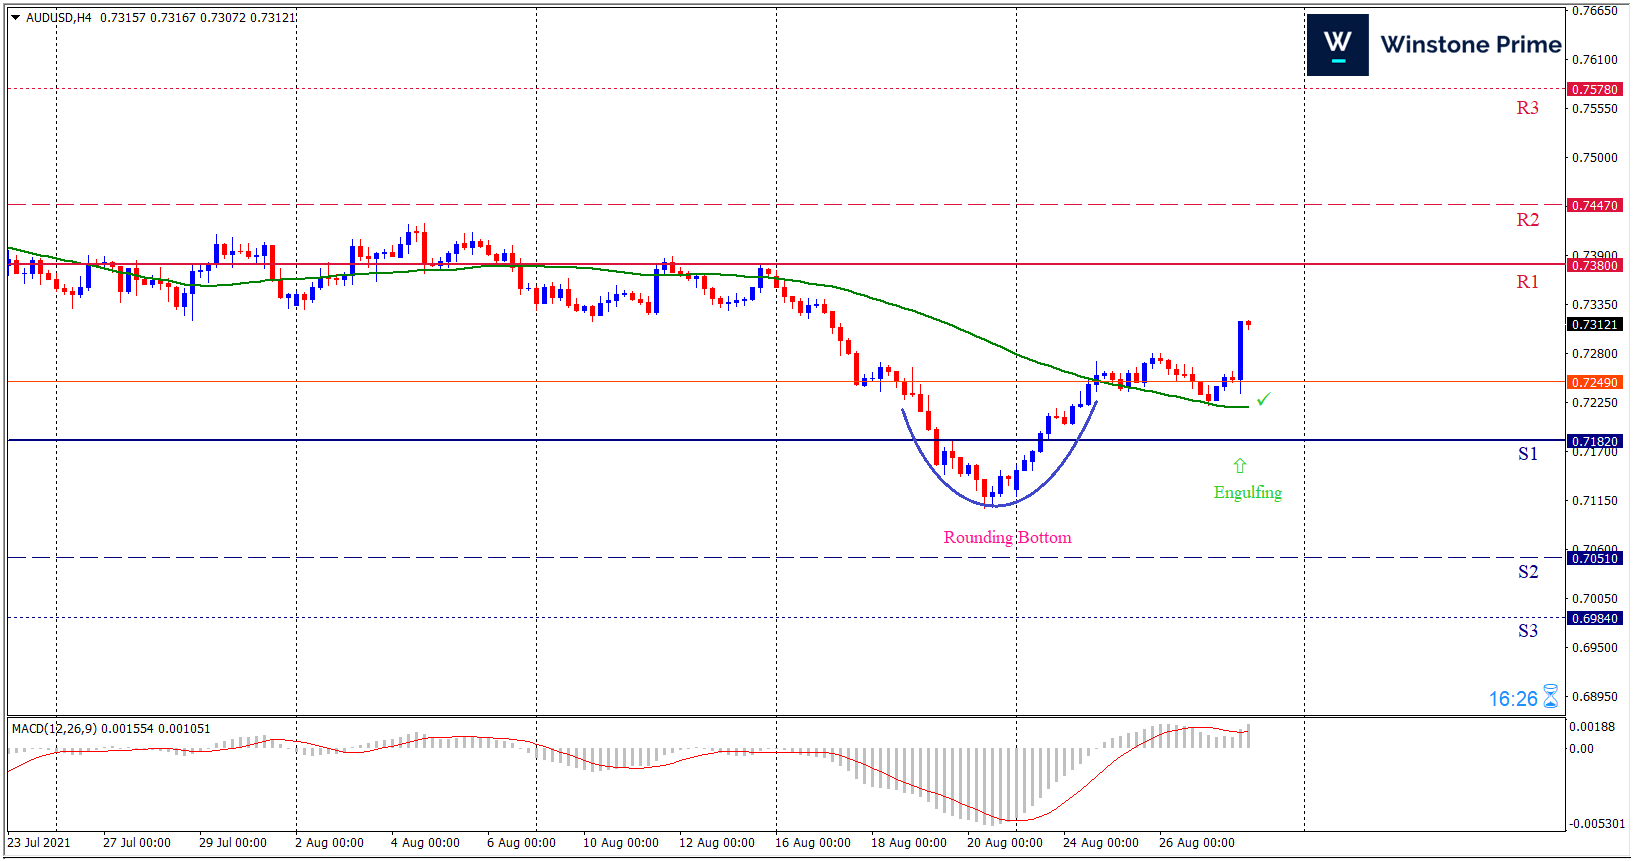
Last week’s high was 0.76% lower than the previous week. Maintaining high at 0.7317 and low at 0.7119 showed a movement of 198 pips.

In the upcoming week we expect AUD/USD to show a bullish trend.  The currency pair is trading above the 50 Simple Moving Average and the MACD trades to the upside. A solid breakout above 0.7380 may open a clean path towards 0.7447 and may take a way up to 0.7578. Should 0.7182 prove to be unreliable support, the AUDUSD may sink downwards 0.7051 and 0.6984 respectively. In H4 chart rounding bottom pattern favors prospects of a bullish trend. Also to be noted Bullish engulfing formation exerts the expectation of uptrend for the pair.

Preference
Buy: 0.7312 target at 0.7446 and stop loss at 0.7244


Alternate Scenario
Sell: 0.7244 target at 0.7116 and stop loss at 0.7312

USD/JPY Weekly Forecast (30th August 2021 – 03rd September 2021)

Fundamental view:

USD/JPY has shown a bullish trend last week. Even tough the US dollar was weak, it portrayed a uptrend against the struggling yen.Dallas Fed President Robert Kaplan showed readiness on considering tapering the bank’s $120 billion/month bond-buying scheme as a response to the Delta COVID-19 variant and Bank announced that t its Jackson Hole Symposium would be held virtually. These were the major reasons behind the US dollar weakness.  In Japan, 33 of the nation’s 47 prefectures are under some type of emergency measures set to last until September 12. Whereas Tokyo has been under restriction since July 12 and cases of the Delta variant have continued to increase. Prime Minister Yoshihide Suga said he hopes to achieve a 60% vaccination rate sometime in September. About 40% of the population which are mostly the elderly, are currently protected.

Japan Markit Manufacturing PMI on 23rd August and US EIA Crude Oil Stocks Change on 25th August created uptrend whereas US Markit Services PMI on 23rd August and US Michigan Consumer Expectations on 27th August created downtrend for the pair.

The major economic events deciding the movement of the pair in the next week are Japan Unemployment Rate at Aug 30, US CB Consumer Confidence Index at Aug 31, US ADP Nonfarm Employment Change, US ISM Manufacturing PMI at Sep 01, BoJ Board Member Kataoka Speech, US Initial Jobless Claims at Sep 02 and US Nonfarm Payrolls at Sep 03.

USD/JPY Weekly outlook:

Technical View:

Last week’s high was 0.04% higher than the previous week. Maintaining high at 110.27 and low at 109.41 showed a movement of 86 pips.

In the upcoming week we expect USD/JPY to show a bullish trend. The currency pair is trading below the 200 Simple Moving Average and the MACD trades to the upside. A solid breakout above 110.28 may open a clean path towards 110.70 and may take a way up to 111.14. Should 109.42 prove to be unreliable support, the USDJPY may sink downwards 108.98 and 108.56 respectively. In H4 chart, Formation of bullish bat pattern indicates reversal of the trend creating prospects of a bullish trend Along with a bullish engulfing formation braces our expectation.

Preference
Buy: 109.86 target at 110.69 and stop loss at 109.37


Alternate Scenario
Sell: 109.37 target at 108.57 and stop loss at 109.86

GBP/USD Weekly Forecast (30th August 2021 – 03rd September 2021)

Fundamental view:

Pound has shown an uptrend against the greenback. Two main reasons behind the greenback downtrend are the signals from the Federal Reserve. Firstly Dallas Fed President Robert Kaplan showed readiness on considering tapering the bank’s $120 billion/month bond-buying scheme as a response to the Delta COVID-19 variant. And next is the bank announcement that its Jackson Hole Symposium would be held virtually. As far as coronavirus is concerned, the US Food & Drugs Administration (FDA) provided a reason to be cheerful, by giving permanent approval to the Pfizer/BioNTech vaccine which turned to be a positive news and adding to it, the cases are turning in to 2 digit numbers and fell in states that were initially hit hard.

US GDP quarterly report on 26th August and US Dallas Fed Trimmed Mean PCE Inflation Rate on 27th August created downtrend whereas US Markit Manufacturing PMI on 23rd August and US EIA Cushing Crude Oil Stocks Change on 25th August created uptrend for the pair.

The major economic events deciding the movement of the pair in the next week are BoE Consumer Credit monthly report, US CB Consumer Confidence Index at Aug 31, UK Markit/CIPS Manufacturing PMI, US ADP Nonfarm Employment Change, US ISM Manufacturing PMI at Sep 01, US Initial Jobless Claims at Sep 02 and US Nonfarm Payrolls at Sep 03.

GBP/USD Weekly outlook:

Technical View:

Last week’s high was 0.70% lower than the previous week. Maintaining high at 1.3781 and low at 1.3606 showed a movement of 175 pips.

In the upcoming week we expect GBP/USD to show a bullish trend.  The currency pair is trading above the 50 Simple Moving Average and the MACD trades to the upside. A solid breakout above 1.3824 may open a clean path towards 1.3890 and may take a way up to 1.3999. Should 1.3649 prove to be unreliable support, the GBPUSD may sink downwards 1.3540 and 1.3474 respectively. Chart formation of cup and handle pattern in H4 chart favors prospects of a bullish trend. Hammer pattern formation escalates the expectation for a bullish trend.

Preference
Buy: 1.3757 target at 1.3889 and stop loss at 1.3644


Alternate Scenario
Sell: 1.3644 target at 1.3475 and stop loss at 1.3757

EUR/USD Weekly Forecast (30th August 2021 – 03rd September 2021)

Fundamental view:

The Euro has rallied a bit during the course of the week. The Geopolitical tensions in Afghanistan and the comments from US Federal Reserve Robert Kaplan who said that September is the time to outline tapering and start it in October, were behind the fall of US dollar. James Bullard, another member of the central bank, also made comments in the same direction.

Europe Industrial Sales yearly report 26th August and Europe Consumer Confidence Index on 27th August created downtrend whereas Europe Markit Services PMI on 23rd August and Europe Ifo Current Business Situation on 25th August created uptrend for the pair.

The major economic events deciding the movement of the pair in the next week are Europe GPD quarterly report, US CB Consumer Confidence Index at Aug 31, Europe Unemployment Rate, US ADP Nonfarm Employment Change, US ISM Manufacturing PMI at Sep 01, US Initial Jobless Claims at Sep 02 and US Nonfarm Payrolls at Sep 03.

EUR/USD Weekly outlook:

Technical View:

Last week’s high was 0.01% higher than the previous week. Maintaining high at 1.1802 and low at 1.1690 showed a movement of 112 pips.

In the upcoming week we expect EUR/USD to show a bullish trend. The currency pair is trading above the 200 Simple Moving Average and the MACD trades to the upside. A solid breakout above 1.1835 may open a clean path towards 1.1875 and may take a way up to 1.1947. Should 1.1723 prove to be unreliable support, the EURUSD may sink downwards 1.1651 and 1.1611 respectively. Chart formation of a bullish flag pattern in H4 chart sets prospects for a bullish trend. Bullish harami formation in H4 chart escalates the expectation for a bullish trend.

Preference
Buy: 1.1796 target at 1.1874 and stop loss at 1.1758


Alternate Scenario
Sell: 1.1758 target at 1.1652 and stop loss at 1.1796