BTC/USD Weekly Forecast (23rd August 2021 – 27th August 2021)

Fundamental view:

Bitcoin traded higher despite greenback showing strength. Bitcoin received a major tailwind as FTX announced a $450,000 grant to Brink, a developer community, on August 13. Launched in 2020 with funding from big names in cryptocurrency markets like the Human Rights Foundation, Square Crypto and crypto exchange Gemini, Brink helps Bitcoin’s open-source developer community. This donation significantly boosted the Bitcoin.

According to a recent news, Bitcoin (BTC) is facing a “double bubble” and will see two price tops this year, fresh data suggests. In a tweet on Wednesday, Charles Edwards, CEO of investment firm Capriole, highlighted 2021 as having one key similarity to the 2013 double top bull cycle. Amidst all the catalysts bitcoin showed a uptrend.

The major economic events deciding the movement of the pair in the next week are Existing Home Sales at Aug 23, Core Durable Goods Orders monthly report, EIA Crude Oil Stocks Change at Aug 25, GDP quarterly report, Initial Jobless Claims at Aug 26 and Fed Chair Powell Speech at Aug 27 for US.

BTC/USD Weekly outlook:

Technical View:

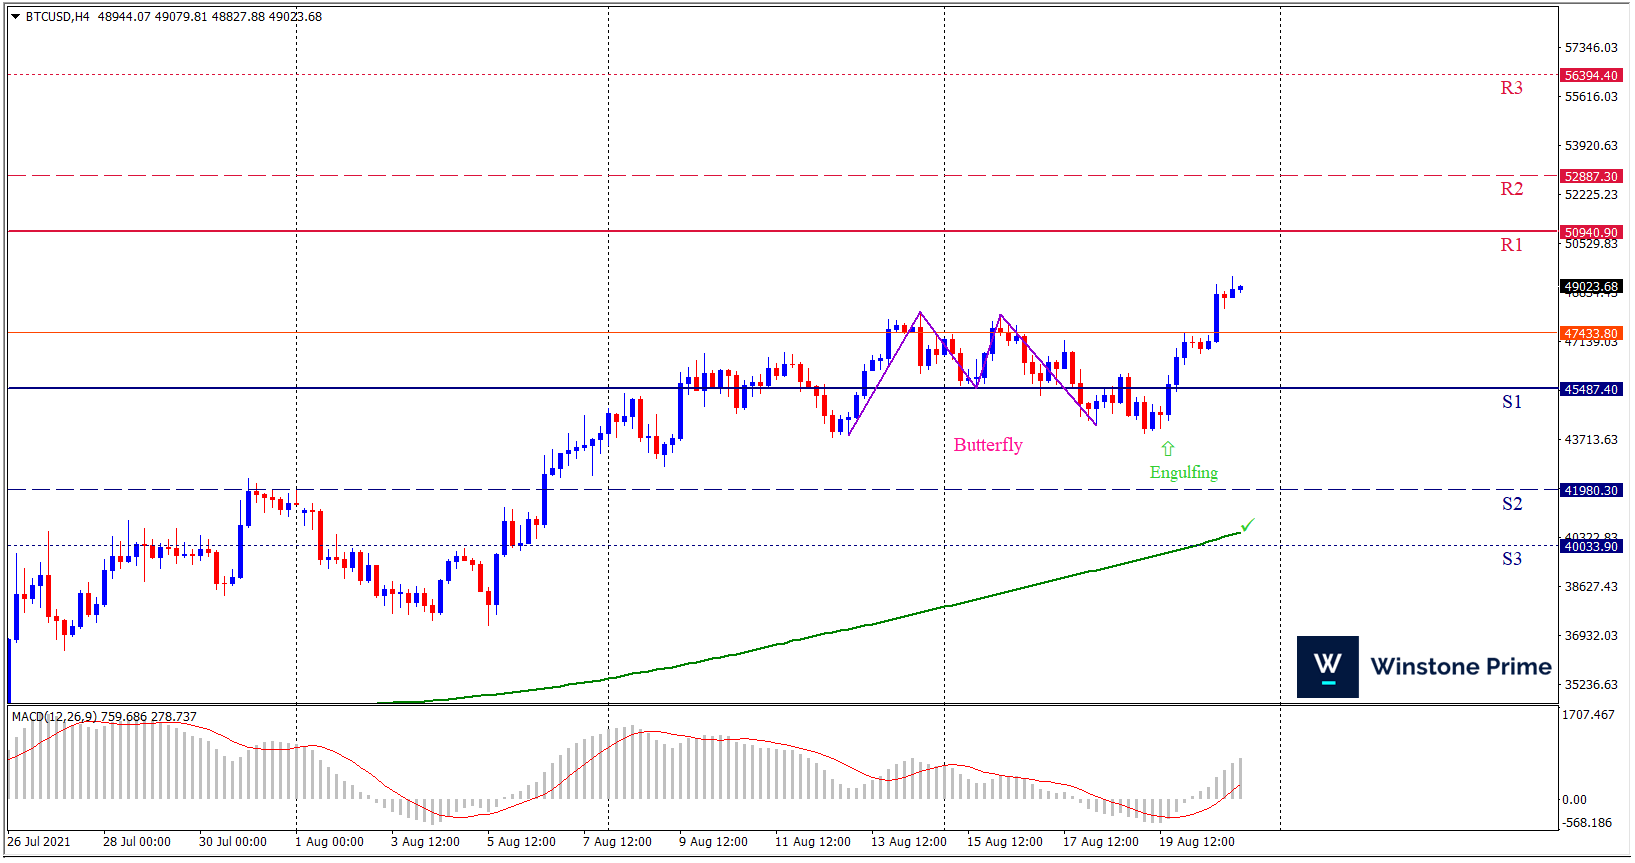
Last week’s high was 2.53% higher than the previous week. Maintaining high at 49380.2 and low at 43926.7 showed a movement of 5453 pips.

In the upcoming week we expect BTC/USD to show a bullish trend. The Instrument is trading above the 200 Simple Moving Average and the MACD trades to the upside. A solid breakout above 50940.9 may open a clean path towards 52887.3 and may take a way up to 56394.4. Should 45487.4 prove to be unreliable support, the BTCUSD may sink downwards 41980.3 and 40033.9 respectively. In H4 chart bullish butterfly pattern formation favors prospects of a bullish trend. Bullish engulfing pattern constructs a bullish outlook for the pair in the upcoming week.

Preference
Buy: 49004.2 target at 52886.3 and stop loss at 47428.8


Alternate Scenario
Sell: 47428.8 target at 41981.3 and stop loss at 49004.2

XAU/USD Weekly Forecast (23rd August 2021 – 27th August 2021)

Fundamental view:

Despite the greenback traded high, Gold managed to traded high. Escalating geopolitical tensions between the US and China along with the increasing number of coronavirus Delta variant cases impacted the market sentiment at the beginning of the week. The Fed’s minutes of its July policy meeting revealed some policymakers saw it appropriate to start preparing for asset tapering soon.

The US Department of Labor announced on Thursday that the Initial Jobless Claims fell to the lowest level. Overall the yellow metal showcased a positive trend against dollar.              

The major economic events deciding the movement of the pair in the next week are Existing Home Sales at Aug 23, Core Durable Goods Orders monthly report, EIA Crude Oil Stocks Change at Aug 25, GDP quarterly report, Initial Jobless Claims at Aug 26 and Fed Chair Powell Speech at Aug 27 for US.

XAU/USD Weekly outlook:

Technical View:

Last week’s high was 0.91% higher than the previous week. Maintaining high at 1795.4 and low at 1770.8 showed a movement of 246 pips.

In the upcoming week we expect XAU/USD to show a bullish trend.  The Instrument is trading above the 50 Simple Moving Average and the MACD trades to the upside. A solid breakout above 1793.6 may open a clean path towards 1806.8 and may take a way up to 1818.2. Should 1769.0 prove to be unreliable support, the XAUUSD may sink downwards 1757.6 and 1744.4 respectively. In H4 chart bullish bat pattern formation favors prospects of a bullish trend. Also to be noted Bullish engulfing formation exerts the expectation of uptrend for the pair.

Preference
Buy: 1781.3 target at 1805.8 and stop loss at 1764.7


Alternate Scenario
Sell: 1764.7 target at 1745.5 and stop loss at 1781.3

AUD/USD Weekly Forecast (23rd August 2021 – 27th August 2021)

Fundamental view:

Aussie traded low against greenback this week. China published weaker-than-anticipated economic data earlier this week as Industrial Production and Retail Sales rose at. Concerns about global growth dominated financial markets. Also Fed published the minutes of its latest FOMC meeting which indicated that the policymakers are ready to discuss the timing of tapering in the upcoming meeting. The market is pricing in that the Fed will kick-start reducing facilities in the last quarter of the year, despite some policymakers believing it would be better to wait until 2022. Amidst all this catalysts, Aussie is on downtrend.

Australia Wage Price Index yearly report on 18th August and US Philadelphia Fed Manufacturing Index on 19th August created uptrend whereas US Fed Capacity Utilization Rate on 17th August and Australia Employment Change on 19th August created downtrend for the pair.

The major economic events deciding the movement of the pair in the next week are US Core Durable Goods Orders monthly report, US EIA Crude Oil Stocks Change at Aug 25, Australia Private New Capital Expenditure quarterly report, US GDP quarterly report, Us Initial Jobless Claims at Aug 26, Australia Retail Sales monthly report and Fed Chair Powell Speech at Aug 27. 

AUD/USD Weekly outlook:

Technical View:

Last week’s high was 0.22% lower than the previous week. Maintaining high at 0.7373 and low at 0.7106 showed a movement of 267 pips.

In the upcoming week we expect AUD/USD to show a bearish trend. The currency pair is trading below the 200 Simple Moving Average and the MACD trades to the downside. A solid breakout below 0.7040 may open a clean path towards 0.6939 and may take a way down to 0.6773. Should 0.7307 prove to be unreliable resistance, the AUDUSD may raise upwards 0.7473 and 0.7574 respectively. In H4 chart double top pattern breakout favors prospects of a bearish trend. Also to be noted harami formation exerts the expectation of downtrend for the pair.

Preference
Sell: 0.7139 target at 0.6941 and stop loss at 0.7211


Alternate Scenario
Buy: 0.7211 target at 0.7472 and stop loss at 0.7139

USD/JPY Weekly Forecast (23rd August 2021 – 27th August 2021)

Fundamental view:

The dollar traded higher against the Japanese yen this week because of the recent dollar strength as of its July 28 meeting. The rise in Covid-19 Delta cases in many of the states in US and across countries were the reason behind the dollar’s gains. The Fed begin its annual three-day Jackson Hole symposium on Thursday August 26. Though the pending taper has been a much conjectured topic, in view of the recent economic data. Whereas Japanese information was largely as expected without any signal of any change in the economy.

Japan GDP quarterly report on 16th August and Japan Adjusted Trade Balance on 18th August created downtrend whereas US Fed Manufacturing Production monthly report on 17th August and US Initial Jobless Claims on 19th August created uptrend for the pair.

The major economic events deciding the movement of the pair in the next week are Japan Markit Manufacturing PMI at Aug 23, BoJ Board Member Nakamura Speech, US Core Durable Goods Orders monthly report, US EIA Crude Oil Stocks Change at Aug 25, US GDP quarterly report, Us Initial Jobless Claims at Aug 26 and Fed Chair Powell Speech at Aug 27. 

USD/JPY Weekly outlook:

Technical View:

Last week’s high was 0.51% lower than the previous week. Maintaining high at 110.23 and low at 109.11 showed a movement of 112 pips.

In the upcoming week we expect USD/JPY to show a bullish trend. The currency pair is trading below the 200 Simple Moving Average and the MACD trades to the nearly neutral. A solid breakout above 110.32 may open a clean path towards 110.83 and may take a way up to 111.44. Should 109.20 prove to be unreliable support, the USDJPY may sink downwards 108.59 and 108.08 respectively. In H4 chart, Formation of cup and handle patterns create the prospects of a bullish trend. Along with a bullish hammer formation braces our expectation.

Preference
Buy: 109.81 target at 110.82 and stop loss at 109.15


Alternate Scenario
Sell: 109.15 target at 108.09 and stop loss at 109.81