GBP/USD Weekly Forecast (23rd August 2021 – 27th August 2021)

Fundamental view:

Pound traded low this week. Fed’s meeting minutes from the July meeting portrays a growing trend toward reducing the bank’s bond-buying scheme already in 2021.After media reports, the media report came about an upcoming announcement in September, which helped the dollar to rise. Increasing coronavirus cases gained importance after America reported some 250,000 in one day, accelerating the increase in average daily infections that topped 140,000. On the other hand, Covid cases in the UK also remain stubbornly high, clearly ending the rapid decrease recorded in mid-July.

US NY Fed Empire State Manufacturing Index on 16th August and Britain PPI Output monthly report on 18th August created uptrend whereas US Fed Industrial Production monthly report on 17th August and Britain Retail Sales monthly report on 20th August created downtrend for the pair.

The major economic events deciding the movement of the pair in the next week are UK Markit/CIPS Manufacturing PMI at Aug 23, US Core Durable Goods Orders monthly report, US EIA Crude Oil Stocks Change at Aug 25, US GDP quarterly report, Us Initial Jobless Claims at Aug 26, UK Nationwide HPI at Aug 27 and Fed Chair Powell Speech at Aug 27. 

GBP/USD Weekly outlook:

Technical View:

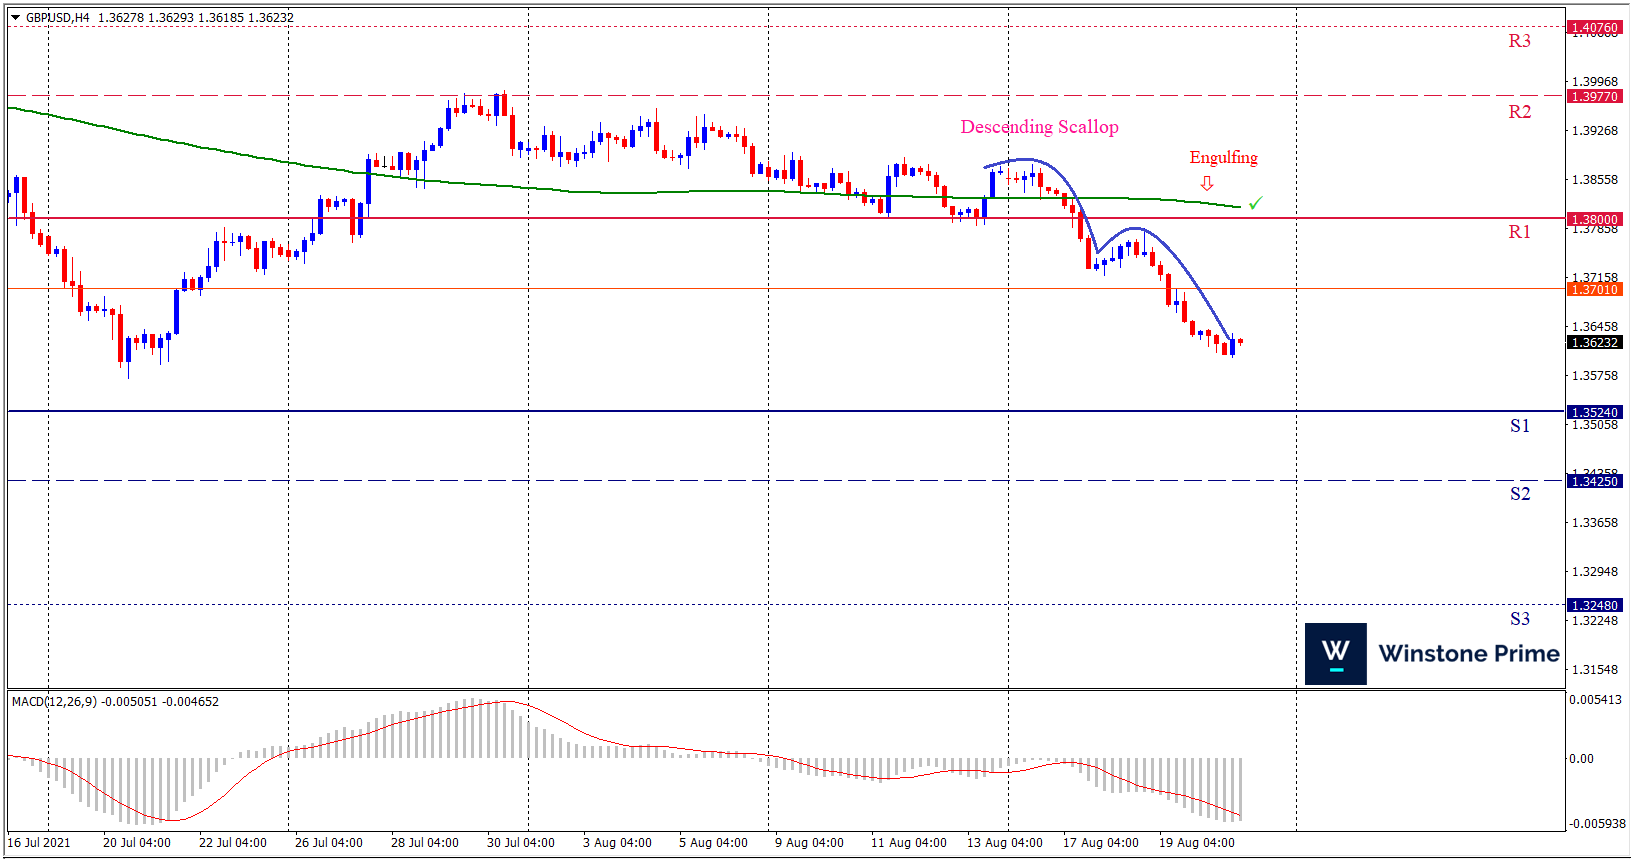
Last week’s high was 0.12% lower than the previous week. Maintaining high at 1.3878 and low at 1.3602 showed a movement of 276 pips.

In the upcoming week we expect GBP/USD to show a bearish trend.  The currency pair is trading below the 200 Simple Moving Average and the MACD trades to the downside. A solid breakout below 1.3524 may open a clean path towards 1.3425 and may take a way down to 1.3248. Should 1.3800 prove to be unreliable resistance, the GBPUSD may raise upwards 1.3977 and 1.4076 respectively. Chart formation of descending scallop pattern in H4 chart favors prospects of a bearish trend. Bearish engulfing pattern formation escalates the expectation for a bearish trend.

Preference
Sell: 1.3622 target at 1.3426 and stop loss at 1.3706


Alternate Scenario
Buy: 1.3706 target at 1.3975 and stop loss at 1.3622

EUR/USD Weekly Forecast (23rd August 2021 – 27th August 2021)

Fundamental view:

Euro traded its lowest at this week. The market moves with the idea of US dollar strength. The FX board is depending on 2 things – higher chances of US tapering and the spread of the coronavirus Delta variant. Fed published the minutes of its latest FOMC meeting which indicated that the policymakers are ready to discuss the timing of tapering in the upcoming meeting. This time, however, hints suggested that retrieving monetary support will be faster than previously anticipated.

US TIC Overall Net Capital Flow on 16th August and Europe Current Account on 19th August created uptrend whereas Europe GDP yearly report on 17th August and US EIA Crude Oil Stocks Change on 18th August created downtrend for the pair.

The major economic events deciding the movement of the pair in the next week are Europe GDP quarterly report at Aug 24, Europe Ifo Business Climate, US Core Durable Goods Orders monthly report, US EIA Crude Oil Stocks Change at Aug 25, ECB Monetary Policy Meeting Accounts, US GDP quarterly report, Us Initial Jobless Claims at Aug 26 and Fed Chair Powell Speech at Aug 27. 

EUR/USD Weekly outlook:

Technical View:

Last week’s high was 0.03% lower than the previous week. Maintaining high at 1.1801 and low at 1.1664 showed a movement of 137 pips.

In the upcoming week we expect EUR/USD to show a bearish trend. The currency pair is trading below the 200 Simple Moving Average and the MACD trades to the downside. A solid breakout below 1.1642 may open a clean path towards 1.1585 and may take a way down to 1.1505. Should 1.1779 prove to be unreliable resistance, the EURUSD may raise upwards 1.1859 and 1.1916 respectively. Chart formation of a pennant pattern in H4 chart sets prospects for a bearish trend. Bearish engulfing formation in H4 chart escalates the expectation for a bearish trend.

Preference
Sell: 1.1701 target at 1.1586 and stop loss at 1.1784


Alternate Scenario
Buy: 1.1784 target at 1.1915 and stop loss at 1.1701

Miners after all 21 million Bitcoins mined

Bitcoin is like a digital gold in many ways. Like gold, bitcoin cannot be created spontaneously; it requires work to “extract”. Gold must be extracted from geological earth and bitcoin “mined” from computational method. There are about 18.5 million Bitcoins are currently and worth about $ 80 billion based on the current BTC price of $ 43,500 per coin. But what happens when all 21 million coins are issued?

There is a lot of speculation about the reasons for Bitcoin creator Satoshi Nagamoto to limit the supply of Bitcoin. Most people believe that this is his approach to creating a tough electronic currency without inflation. Whatever may be the reason some questions arising like when all Bitcoins will be mined? Also, what will happen to Bitcoin miners once this happens?

Why Bitcoin is better than Gold?

Being digitally Bitcoin takes gold’s benefits a step ahead.  The supply of Bitcoin is not only handled arbitrarily, but also eliminates the need for paper substitutes, which are weightless and almost inexpensive to save. Because gold is so heavy and takes up so much physical space, people under the gold standard prefer paper alternatives to gold rather than carrying real coins with them. This practice leaves gold in the bank and makes people trust the bank to handle gold responsibly. 

Thus, even under strict gold standards, banks can betray the trust of their hosts, create new deposits and provide reliable media. The digital nature of Bitcoin eliminates this problem; It costs almost nothing to save, and since it takes an extra zero, you can carry Bitcoin on someone without an extra burden. No more paper substitutes needed, banks no longer have the opportunity to make money from thin air.

In spite of promising benefits, people also taking advantage of the fact that Bitcoin has a limited supply.

Limited supply of Bitcoins

The miners are not “creating” any new bitcoin, even if it seems like they do. In fact, when Satoshi Nagamoto introduced Bitcoin in January 2009, he released all 21 million Bitcoins. The real role of a miner is to protect the network and process Bitcoin transactions. Every 10 minutes a successful miner finds a new block by solving a cryptographic puzzle and is allowed to add it to the Bitcoin blockchain.

Currently, there are two things that miners make money:

  • Minted money
  • Transaction fees.

1. Minted Money – Within the Bitcoin protocol, 25 BTC is generated in every ten minutes. Mining is critical to the integrity of the Bitcoin protocol, so work should be encouraged to ensure the network is operational. However, the amount of BTC is halved every 4 years so that the profit of the mine is less and less available. However, mining is not just dependent on mining because there are small transaction fees whenever a transaction is made, which also goes to the miners. Currently, these make up a small portion of the profits, however, as the number of minted BTCs is small, transaction fees will begin to play a very important role in the BTC network.

2. Transaction Fees – As a result of the limit supply of bitoins can hit the currency becomes the deflationary currency. Currently, thousands of BTC are produced daily, which causes inflation, however once the BTC mine stops, the currency will stop inflating. If someone receives a few BTCs and then forgets his account, that person will have to delete a few BTCs, or at least a few thousand satoshis (subdivision of BTC equals ten nanobitcoins, or 1 / 100,000,000 of a bitcoin). This action, while not trivial as an individual, is a somewhat regular occurrence and will reduce the number of BTCs and increase the value of BTCs in the long run. This deflation, coupled with increasing popularity, will make it seem cheap to us in 10 years (now) and incredibly expensive in 100 years. Compare this to the US dollar (US dollar), because any American who listens to grandparents will remember that it used to cost 1 cent then, and now seems incredibly cheap to our modern economy. The important thing is that instead of governments printing more money and converting goods to higher prices, Bitcoins will be destroyed over time and the price of goods will be lower. Whether it is good or not depends on what you consider is good and how you view the economy.

Bitcoin has the mathematical scarcity of complete history. This scarcity can be verified by any member of the network and is controlled by a mechanism in the source code of Bitcoin. This algorithm allows the miners who create the blocks to obtain the newly minted Bitcoin. This subsidy helps the miners to cover the high cost of mining. However, every four years, the algorithm cuts the subsidy in half in an event called the halving. This process will continue until the year 2140, when the flow of new bitcoin will decrease from one satoshi per block to zero.

When a halving occurs, miner revenue is roughly cut in half. As with any industry, a 50% loss in revenue can force a business out of operation. In the case of Bitcoin, mining directly provides security to the network, so a flight of miners from the network could jeopardize Bitcoin’s security model. As the block subsidy trends towards zero, Bitcoin skeptics believe that low miner revenue could lead to lower security and a diminishing value proposition for Bitcoin itself.

What will happen if Bitcoin miners stopped processing Bitcoin

One issue that critics want to discuss about the stable distribution of bitcoin is how miners will react once they lose their block rewards and the mining system will become unstable because miners will have to rely on transaction fees to finance themselves financially. If majority of miners stopped mining Bitcoin, then the Bitcoin network can change forever. But you can able to view which wallet addresses hold Bitcoin, You can able to view the entire history of every single Bitcoin transaction ever made. 

But confirming new transactions requires mining. If miners stop producing new blocks, it would effectively become impossible to spend any Bitcoin in the future. That’s quite the doomsday warning for the Bitcoin network, but many believe miners will stay the course, even once transaction fees are their only reward. 

Conclusion

It can be tricky to guess when Bitcoin will reach its maximum limit. But some crypto geeks say that if the mining power of Bitcoin is the same as the first block was mined, the last BTC can be mined by October 8, 2140. Others claim that Bitcoin is still used as a currency and performs similar functions. With Fiat money, there is a chance it will be highly stabilized. As a very popular and leading virtual asset over thousands of others, BTC will be remembered as an invaluable asset not only in terms of market capitalization and price but also for its outstanding contribution to improving the position of today’s financial system.

Complete Vaccination program favors yen

USD/JPY is on downtrend after the decision of Complete vaccination program. Japan Ministry of Finance (MOF) announced today early morning that the cabinet’s approval of an emergency budget to battle the pandemic. “Japan’s cabinet approved a 9.27 billion yen ($84.50 million) emergency budget to help the country’s self-defense forces carry out medical aid amid the coronavirus pandemic,” Reported in Reuters.

Wheras Bloomberg has reported Japan’s vaccination drive has slowed, but is now on track to beat the current U.S. vaccine rate within weeks – good news for a economy that has endured one viral crisis after another. If the current pace is maintained, 51% of the population in Japan will be fully vaccinated by September 12. As soon as Sunday, the country will meet a major milestone and reach the 40% target set by Prime Minister Yoshihide Suga. Amid widespread criticism, the table does not do enough to control Japan’s Covid-19 cases.

Japan’s core consumer price index (CPI), which includes oil but excludes fresh food prices, fell 0.2% in July from a year earlier, marking the 12th straight month of declines, government data showed on Friday. The fall was due in part to a change in the base year for the CPI that gives a heavier weighting to mobile charge fees, which plunged a record 39.6% in July. But the drop was smaller than market forecasts for a 0.4% fall and a 0.5% decrease in June due to the boost from rising food and fuel costs, including a 19.6% spike in gasoline bills.

Prices of refrigerators and air conditioners, as well as accommodation fees, also rose in a sign some households were keen to spend after hunkering down during repeated stop-and-go state of emergency curbs. Japan’s economy rebounded more than expected in the second quarter after slumping in the first three months of this year, a sign consumption and capital expenditure were recovering from the coronavirus pandemic’s initial hit. But many analysts expect growth to remain modest in the current quarter as curbs reimposed to combat a spike in infections weigh on household spending.

Meanwhile Japan saw Burst of economic activity It grew for the second straight quarter as consumers returned to empty restaurants, bars and theaters in late 2020 and began to traverse the country on trips undertaken by the government’s reconstruction plan. Now, recovery depends on the government’s vaccination program and other efforts being able to control the spread of the virus. The country gives more than 1 million shots a day. If we can maintain that pace, we will exceed vaccination levels in the United States and the United Kingdom by early fall. However, if the vaccination program goes smoothly, Japan will “return to normal economic activity,” said Keiji Kanda, senior economist at Daiwa Institute of Research.

USD/JPY 4 Hour Chart:

Support: 109.42 (S1), 109.08 (S2), 108.68 (S3).

Resistance: 110.17 (R1), 110.57 (R2), 110.91 (R3).

Amidst all the catalysts favoring yen to some extent. We expect a bearish trend for USD/JPY.