AUD/USD Weekly Forecast (16th August 2021 – 20th August 2021)

Fundamental view:

The Australian dollar has gone back and forth during the course of the trading and ended forming a bullish candle. In Australia, regional lockdowns have been once again extended, and macroeconomic data has continued to reflect the poor performance of the economy. Whereas US Senate has finally passed a $1 trillion bipartisan infrastructure bill to rebuild the US economy and the Congressmen prepared a framework to approve a $3.5 trillion Democratic budget.

US Nonfarm Productivity quarterly report on 10th August and US EIA Crude Oil Stocks Change on 11th August created uptrend whereas US CB Employment Trends Index on 9th August and Australia NAB Business Confidence on 10th August created downtrend for the pair.

The major economic events deciding the movement of the pair in the next week are US NY Fed Empire State Manufacturing Index at Aug 16, RBA Meeting Minutes, US Retail Sales monthly report, US Fed Industrial Production monthly report at Aug 17, FOMC Minutes at Aug 18, Australia Employment Change, US Philadelphia Fed Manufacturing Index and US Initial Jobless Claims at Aug 19.

AUD/USD Weekly outlook:

Technical View:

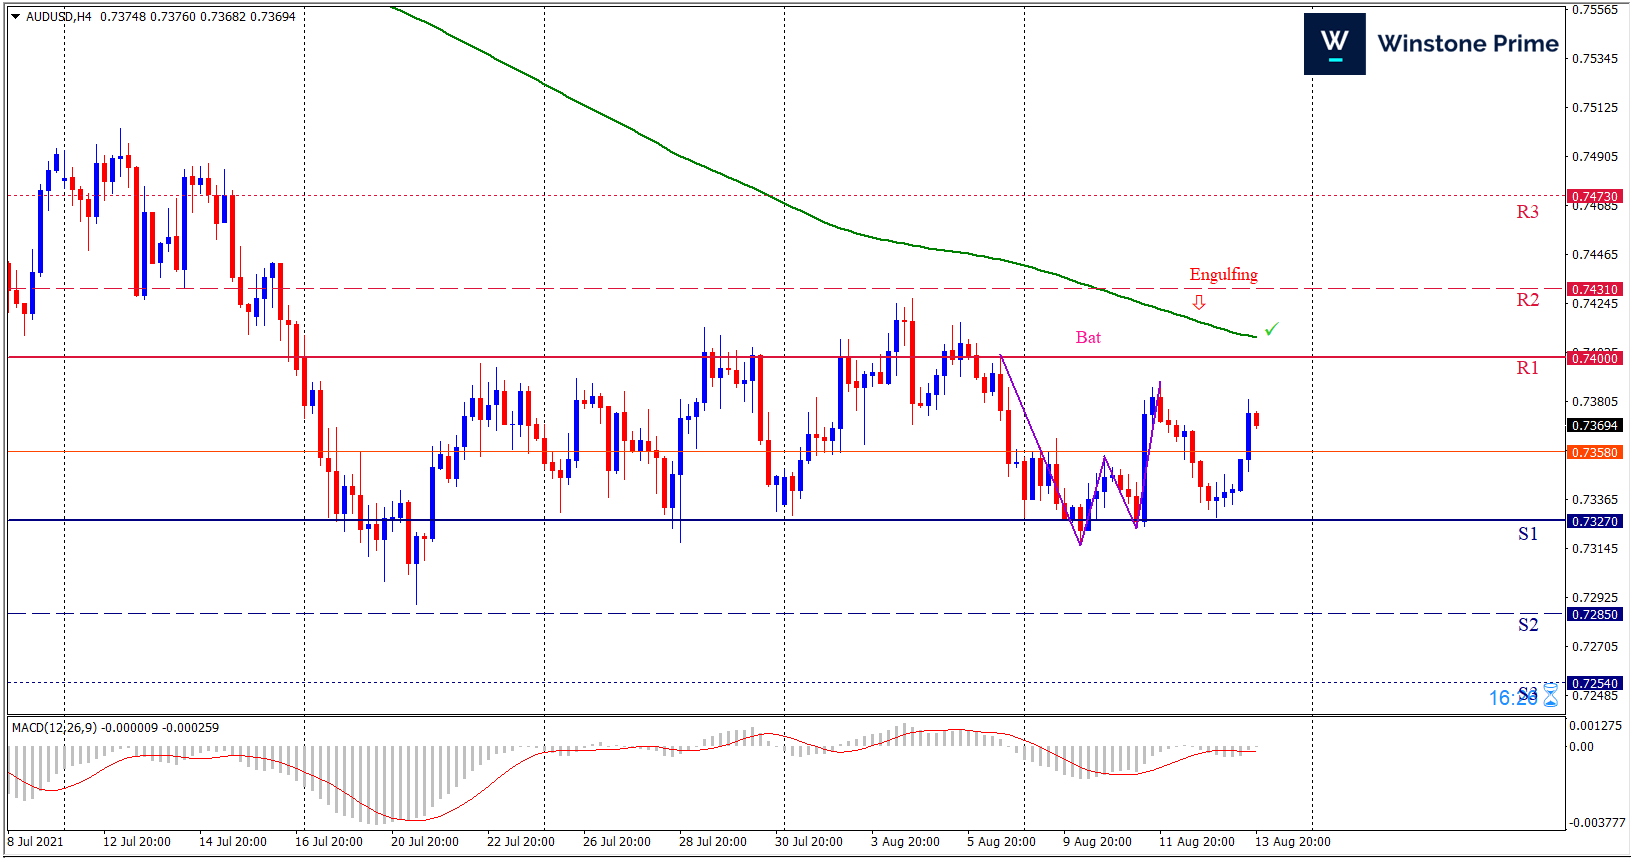
Last week’s high was 0.50% lower than the previous week. Maintaining high at 0.7389 and low at 0.7316 showed a movement of 73 pips.

In the upcoming week we expect AUD/USD to show a bearish trend.  The currency pair is trading below the 200 Simple Moving Average and the MACD trades to the downside. A solid breakout below 0.7327 may open a clean path towards 0.7285 and may take a way down to 0.7254. Should 0.7400 prove to be unreliable resistance, the AUDUSD may raise upwards 0.7431 and 0.7473 respectively. A bearish bat pattern formation in H4 chart favors a bearish trend. Also to be noted bearish engulfing formation exerts the expectation of downtrend for the pair.

Preference
Sell: 0.7366 target at 0.7292 and stop loss at 0.7405


Alternate Scenario
Buy: 0.7405 target at 0.7472 and stop loss at 0.7366

USD/JPY Weekly Forecast (16th August 2021 – 20th August 2021)

Fundamental view:

Greenback dropped against the Japanese yen in the last week due to the sharp decline witnessed in the US Treasury bond yields and the broad-based USD weakness. Federal Reserve policy is also undetermined. Several bank officials, including Vice-Chair Richard Clarida, made a suggestion that a reduction in the amount of bond purchases may be nearing. The Fed’s contention that the recent inflation spike is temporary will be discussed at the August 26-28 annual Jackson Hole symposium, but whether the conclave will produce a consensus for the FOMC meeting a month later is highly speculative.

Japan Economy Watchers Index for Current Conditions on 10th August and Japan BoJ L Money Stock yearly report on 11th August created uptrend whereas Japan BoJ Corporate Goods Price Index monthly report on 12th August and US Export Price Index monthly report on 13th August created downtrend for the pair.

The major economic events deciding the movement of the pair in the next week are Japan Industrial Production monthly report, US NY Fed Empire State Manufacturing Index at Aug 16, US Retail Sales monthly report, US Fed Industrial Production monthly report at Aug 17, FOMC Minutes at Aug 18, Japan Core CPI yearly report, US Philadelphia Fed Manufacturing Index and US Initial Jobless Claims at Aug 19.

USD/JPY Weekly outlook:

Technical View:

Last week’s high was 0.41% higher than the previous week. Maintaining high at 110.80 and low at 109.55 showed a movement of 125 pips.

In the upcoming week we expect USD/JPY to show a bullish trend. The currency pair is trading below the 200 Simple Moving Average and the MACD trades to the upside. A solid breakout above 110.41 may open a clean path towards 111.23 and may take a way up to 111.66. Should 109.16 prove to be unreliable support, the USDJPY may sink downwards 108.73 and 107.91 respectively. In H4 chart, Formation of bullish crab pattern indicates prospects of a bullish trend Along with a hammer formation brace our expectation.

Preference
Buy: 109.58 target at 110.79 and stop loss at 109.11


Alternate Scenario
Sell: 109.11 target at 107.92 and stop loss at 109.58

GBP/USD Weekly Forecast (16th August 2021 – 20th August 2021)

Fundamental view:

Pound has declined against the greenback but closed slightly below the open price. Monetary policy of Bank of England (BOE)  is cautious and not about to change until it is clear that the pandemic is no longer a threat to the economy. This might last through the winter flu season. Consumer prices are rising but the gains are nowhere near as dangerous as in the United States. Whereas The central bank is trying to cool down tightening expectations by saying that heating inflation will likely be temporary and resting on the tepid progress in the job sector which will help to maintain the ultra-loose monetary policy.

US Real Earnings monthly report on 11th August and US Import Price Index monthly report on 13th August created uptrend whereas US JOLTS Job Openings on 9th August and Britain Industrial Production monthly report on 12th August created downtrend for the pair.

The major economic events deciding the movement of the pair in the next week are US NY Fed Empire State Manufacturing Index at Aug 16, UK Claimant Count Change, US Retail Sales monthly report, US Fed Industrial Production monthly report at Aug 17, FOMC Minutes at Aug 18, US Philadelphia Fed Manufacturing Index, US Initial Jobless Claims at Aug 19 and UK Retail Sales monthly report at Aug 20. 

 GBP/USD Weekly outlook:

Technical View:

Last week’s high was 0.44% lower than the previous week. Maintaining high at 1.3895 and low at 1.3791 showed a movement of 104 pips.

In the upcoming week we expect GBP/USD to show a bearish trend.  The currency pair is trading below the 50 Simple Moving Average and the MACD trades to the downside. A solid breakout below 1.3807 may open a clean path towards 1.3747 and may take a way down to 1.3703. Should 1.3911 prove to be unreliable resistance, the GBPUSD may raise upwards 1.3955 and 1.4015 respectively. Chart formation of diamond pattern breakout in H4 chart favors prospects of a bearish trend. Bearish engulfing pattern formation escalates the expectation for a downtrend.

Preference
Sell: 1.3866 target at 1.3763 and stop loss at 1.3916


Alternate Scenario
Buy: 1.3916 target at 1.4014 and stop loss at 1.3866

EUR/USD Weekly Forecast (16th August 2021 – 20th August 2021)

Fundamental view:

The Euro has fallen hard during the course of the trading week but later picked up. The dominant downtrend was interrupted on Wednesday, following the release of US inflation figures. The central bank is trying to cool down tightening expectations by saying that heating inflation will likely be temporary and resting on the tepid progress in the job sector which will help to maintain the ultra-loose monetary policy. On the other hand, there have been a couple of weeks of silence from ECB after European policymakers pledged to maintain a “persistently accommodative” monetary policy as the pandemic impacted over the economic recovery.

Europe Trade Balance on 9th August and Europe ZEW Economic Sentiment Indicator on 10th August created downtrend whereas US Core CPI monthly report on 11th August and US Michigan Consumer Sentiment on 13th August created uptrend for the pair.

The major economic events deciding the movement of the pair in the next week are US NY Fed Empire State Manufacturing Index at Aug 16, Europe Employment Change quarterly report, Europe GDP quarterly report, US Retail Sales monthly report, US Fed Industrial Production monthly report at Aug 17, FOMC Minutes at Aug 18, US Philadelphia Fed Manufacturing Index and US Initial Jobless Claims at Aug 19. 

EUR/USD Weekly outlook:

Technical View:

Last week’s high was 0.79% lower than the previous week. Maintaining high at 1.1805 and low at 1.1706 showed a movement of 99 pips.

In the upcoming week we expect EUR/USD to show a bearish trend. The currency pair is trading below the 200 Simple Moving Average and the MACD trades to the downside. A solid breakout below 1.1733 may open a clean path towards 1.1670 and may take a way down to 1.1634. Should 1.1832 prove to be unreliable resistance, the EURUSD may raise upwards 1.1868 and 1.1931 respectively. Chart formation of a Bearish butterfly pattern in H4 chart sets prospects for a bearish trend. Harami formation in H4 chart escalates the expectation for a bearish trend.

Preference
Sell: 1.1794 target at 1.1705 and stop loss at 1.1837


Alternate Scenario
Buy: 1.1837 target at 1.1930 and stop loss at 1.1794