BTC/USD Weekly Forecast (4th April 2022 – 8th April 2022)

Fundamental view:

Bitcoin traded down against the US dollar during the first half but later traded up and erased its losses at the second of the week. The US dollar bulls was underpinned by the NFP report. US March’s Nonfarm Payrolls report came at 431K jobs added, more than the 80K foreseen by economists. Thus market perceived it as a solid report. Further, the Unemployment rate lowered from 3.8% YoY in February to 3.6% in March and beat the 3.7% expected.

On the other hand,  Recent comment from Mike Novogratz and Vla Costea favored the Bitcoin. Billionaire Mike Novogratz said he is much more optimistic about the crypto market now than he was a month ago. He explained that bond sell-offs and increased crypto adoption have boosted the prices of cryptocurrencies, particularly bitcoin. “I think you are going to see the Democrats taking a softer stance,” he added. According to Vlad Costea, founder of Bitcoin Takeover, there are “only 2 million BTC left to mine in the next 118 years!” Over the past 13 years since the inception of Bitcoin, miners have uncovered 19 million Bitcoin; the last Bitcoin is expected to be mined in the year 2140.

The major economic events deciding the movement of the pair in the next week are ISM Non-Manufacturing PMI, Fed Governor Brainard Speech at Apr 05, EIA Crude Oil Stocks Change, FOMC Minutes at Apr 06, Initial Jobless Claims at Apr 07 and WASDE Report at Apr 08 for US.

BTC/USD Weekly outlook:

Technical View:

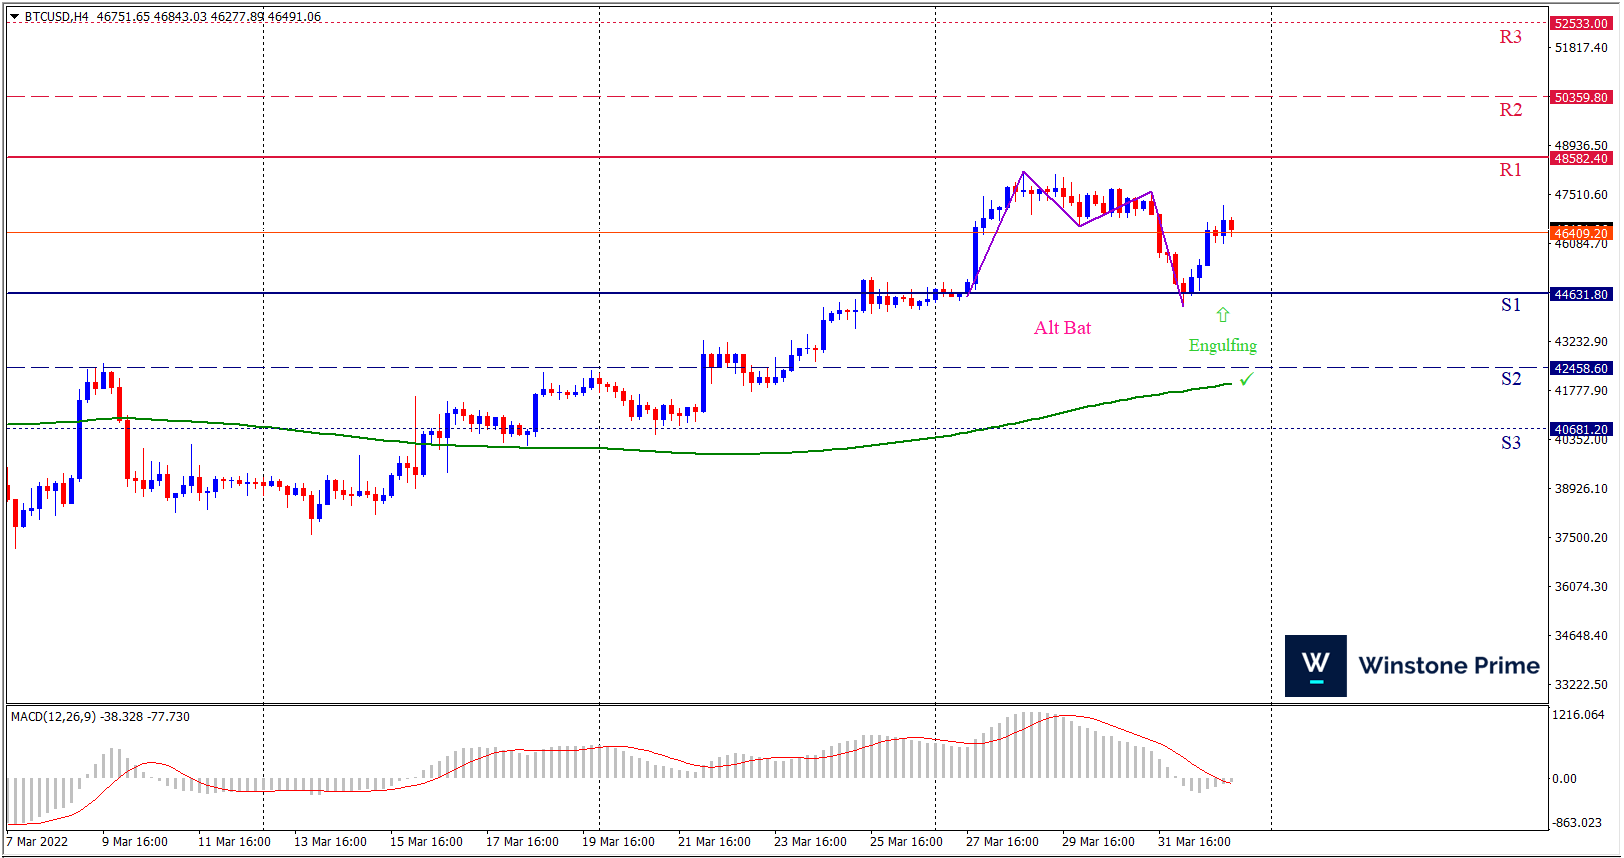
Last week’s high was 3.13% higher than the previous week. Maintaining high at 48186.5 and low at 44235.9 showed a movement of 3951 pips.

In the upcoming week we expect BTC/USD to show a bullish trend. The Instrument is trading above the 200 Simple Moving Average and the MACD trades to the downside. A solid breakout above 48582.4 may open a clean path towards 50359.8 and may take a way up to 52533.0. Should 44631.8 prove to be unreliable support, the BTCUSD may sink downwards 42458.6 and 40681.2 respectively. In H4 chart bullish alt bat pattern formation favors prospects of a bullish trend. Bullish engulfing pattern constructs a bullish outlook for the pair in the upcoming week.

Preference
Buy: 46500.7 target at 50358.4 and stop loss at 44626.4


Alternate Scenario
Sell: 44626.4 target at 40682.5 and stop loss at 46500.7

XAU/USD Weekly Forecast (4th April 2022 – 8th April 2022)

Fundamental view:

Gold traded low against the US dollar during the trading course of the week. US NFP report and the Optimism on ceasefire between Russia-Ukraine were the major catalysts which weighed on the yellow metal. Risk on market sentiment dominated the markets amidst renewed optimism for a diplomatic solution to the Russia-Ukraine conflict which did not favor the safe haven gold. Following Tuesday’s talks, a Ukrainian negotiator said that they made enough progress to plan a meeting between Ukrainian President Volodymyr Zelenskyy and his Russian counterpart Vladimir Putin. Furthermore, Russia’s ministry of defense announced that military activity in Kyiv and Chernihiv will be scaled down significantly in order to create conditions for further dialogue.

US March’s Nonfarm Payrolls report came at 431K jobs added, more than the 80K foreseen by economists. Thus market perceived it as a solid report. Further, the Unemployment rate lowered from 3.8% YoY in February to 3.6% in March and beat the 3.7% expected. That keeps the Fed on track for aggressive monetary policy, which favored the greenback.

The major economic events deciding the movement of the pair in the next week are ISM Non-Manufacturing PMI, Fed Governor Brainard Speech at Apr 05, EIA Crude Oil Stocks Change, FOMC Minutes at Apr 06, Initial Jobless Claims at Apr 07 and WASDE Report at Apr 08 for US.

XAU/USD Weekly outlook:

Technical View:

Last week’s high was 0.36% lower than the previous week. Maintaining high at 1959.2 and low at 1889.8 showed a movement of 694 pips.

In the upcoming week we expect XAU/USD to show a bullish trend. The Instrument is trading below the 200 Simple Moving Average and the MACD trades to nearly neutral. A solid breakout above 1959.4 may open a clean path towards 1994.0 and may take a way up to 2028.8. Should 1890.0 prove to be unreliable support, the XAUUSD may sink downwards 1855.2 and 1820.6 respectively. In H4 chart bullish butterfly pattern favors prospects of a bullish trend. Also to be noted hammer formation exerts the expectation of uptrend for the pair.

Preference
Buy: 1924.9 target at 1993.5 and stop loss at 1885.6


Alternate Scenario
Sell: 1885.6 target at 1822.7 and stop loss at 1924.9

AUD/USD Weekly Forecast (4th April 2022 – 8th April 2022)

Fundamental view:

The Australian dollar traded low against the American dollar during the trading course of the week. The divergence in the monetary policy was the major catalyst behind the move. US March’s Nonfarm Payrolls report came at 431K jobs added, more than the 80K foreseen by economists. Thus market perceived it as a solid report. Further, the Unemployment rate lowered from 3.8% YoY in February to 3.6% in March and beat the 3.7% expected.That keeps the Fed on track for aggressive monetary policy, which favored the greenback.

On the other hand, An interest rate hike in Australia this year is “plausible,” Reserve Bank of Australia (RBA) Governor Philip Lowe said last month The RBA gradually walked back on its pledge of no rate rise before 2024 and still remains in a patient mode after highlighting that the war in Ukraine is a major new source of uncertainty in its March policy announcements. The RBA is about to maintain its stance even in coming days as it is unlikely to change this time around, as it may continue to remain data-dependent, waiting for signs of wage inflation before responding to broad inflationary pressures.

In this week, Australia Retail Sales monthly report on 29th March and US GDP quarterly report on 30th March favored bullish trend whereas Australia NAB Quarterly Business Confidence on 28th March, US Core PCE Price Index monthly report on 31st March and Nonfarm Payrolls on 1st April the bearish trend for the pair.

The major economic events deciding the movement of the pair in the next week are Australia Commonwealth Bank Services PMI at Apr 04, RBA Interest Rate Decision, US ISM Non-Manufacturing PMI, Fed Governor Brainard Speech at Apr 05, EIA Crude Oil Stocks Change, FOMC Minutes at Apr 06, US Initial Jobless Claims at Apr 07, RBA Financial Stability Review and US WASDE Report at Apr 08.

AUD/USD Weekly outlook:

Technical View:

Last week’s high was 0.04% higher than the previous week. Maintaining high at 0.7539 and low at 0.7455 showed a movement of 84 pips.

In the upcoming week we expect AUD/USD to show a bearish trend. The currency pair is trading below the 50 Simple Moving Average and the MACD trades to nearly neutral. Should 0.7454 proves to be unreliable support then the pair may fall further to 0.7412 and 0.7370 respectively whereas a solid breakout above 0.7538 will open a clear path upward to 0.7580 and then will further raise up to 0.7622. In H4 chart rounding top pattern favors prospects of a bearish trend. Also to be noted bearish harami formation exerts the expectation of downtrend for the pair.

Preference
Sell: 0.7495 target at 0.7415 and stop loss at 0.7542


Alternate Scenario
Buy: 0.7542 target at 0.7621 and stop loss at 0.7495

USD/JPY Weekly Forecast (4th April 2022 – 8th April 2022)

Fundamental view:

US dollar edged higher against its yen counterpart during the trading course of the week. The US Bureau of Labor Statistics reported that Nonfarm Payrolls in March rose by 431,000. The reading was far better than the market expectation of 80,000, Moreover, February’s print got revised higher to 750,000 from 678,000. The March NFP report is the last before the May 4 FOMC meeting. The Fed is expected to increase the fed funds rate by 0.5%. Moreover,  US T-bond yields continued to push higher as the publication revealed that Average Hourly Earnings climbed to 5.6% from 5.2% on a yearly basis. All the catalysts underpinned the USD bulls.

On the other hand,  Japanese economic data for February was mixed. Retail Trade (sales) fell 0.8% for the month and year on forecasts of -0.3% and flat. Industrial Production was slower for the month at 0.1% than the 0.5% prediction but better for the year, 0.2% vs -2.3%. 

In this week, Japan Jobs to Applicants Ratio on 29th March and US GDP quarterly report on 30th March  underpinned the downtrend whereas Japan Retail Sales monthly report on 30th March, US Core PCE Price Index yearly report  on 31st March, Nonfarm Payrolls report on 1st April underpinned the uptrend for the pair.

The major economic events deciding the movement of the pair in the next week are Japan Markit Services PMI, US ISM Non-Manufacturing PMI, Fed Governor Brainard Speech at Apr 05, EIA Crude Oil Stocks Change, FOMC Minutes at Apr 06, BoJ Board Member Noguchi Speech, US Initial Jobless Claims at Apr 07 and US WASDE Report at Apr 08.

USD/JPY Weekly outlook:

Technical View:

Last week’s high was 2.18% higher than the previous week. Maintaining high at 125.10 and low at 121.28 showed a movement of 382 pips.

In the upcoming week we expect USD/JPY to show a bullish trend. The currency pair is trading above the 200 Simple Moving Average and the MACD trades to the upside. A solid breakout above 124.61 may open a clean path towards 126.77 and may take a way up to 128.43. Should 120.79 prove to be unreliable support, the USDJPY may sink downwards 119.13 and 116.97 respectively. In H4 chart, Formation of bullish pennant pattern indicates reversal of the trend creating prospects of a bullish trend Along with a bullish harami formation braces our expectation.

Preference
Buy: 122.47 target at 126.15 and stop loss at 120.74


Alternate Scenario
Sell: 120.74 target at 116.98 and stop loss at 122.47