BTC/USD Weekly Forecast (09th August 2021 – 13th August 2021)

Fundamental view:

Bitcoin has shown an uptrend against the greenback in the past week. Because of the Chinese laws around digital currency mining, the miner exodus had a major impact on the Bitcoin hash rate, miners, and the mining equipment producers. After weeks of migration to mining-friendly countries, Bitcoin miners had made a comeback.

The 9, a Shanghai-based mining firm, said on August 4 that its subsidiary NBTC Ltd. had partnered with Kazakhstani mining partner KazDigital to build a 100 megawatt mining facility by 2022.

Adding to it, HIVE Blockchain, a publicly-traded company, announced on August 3 that it placed orders for 4,000 machines from China’s mining equipment manufacturer Canaan. Amidst all this favorable news, bullish trend is reflected by Bitcoin.

The major economic events deciding the movement of the pair in the next week are JOLTS Job Openings at Aug 09, Nonfarm Productivity at Aug 10, EIA Crude Oil Stocks Change, Federal Budget Balance at Aug 11, Initial Jobless Claims, WASDE Report at Aug 12 and Michigan Consumer Sentiment at Aug 13 for US.

BTC/USD Weekly outlook:

Technical View:

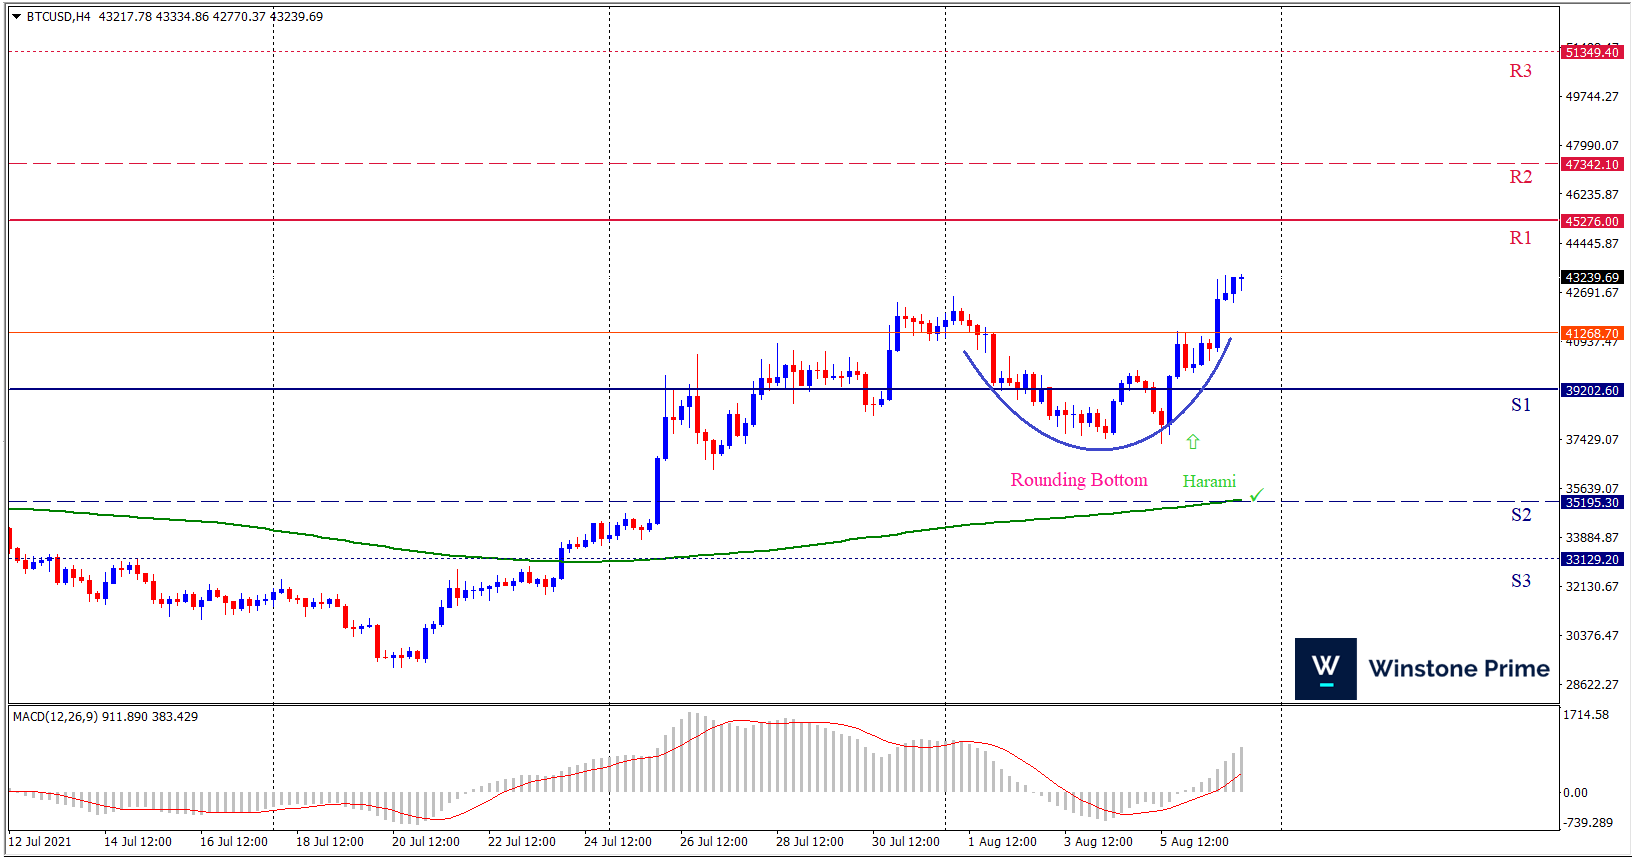
Last week’s high was 2.31% higher than the previous week. Maintaining high at 43334.9 and low at 37261.5 showed a movement of 6073 pips.

In the upcoming week we expect BTC/USD to show a bullish trend. The Instrument is trading above the 200 Simple Moving Average and the MACD trades to the upside. A solid breakout above 45276.0 may open a clean path towards 47342.1 and may take a way up to 51349.4. Should 39202.6 prove to be unreliable support, the BTCUSD may sink downwards 35195.3 and 33129.2 respectively. In H4 chart rounding bottom pattern favors prospects of a bullish trend. Bullish harami pattern constructs a bullish outlook for the pair in the upcoming week.

Preference
Buy: 43152.5 target at 48753.2 and stop loss at 41263.7


Alternate Scenario
Sell: 41263.7 target at 35196.4 and stop loss at 43152.5

XAU/USD Weekly Forecast (09th August 2021 – 13th August 2021)

Fundamental view:

The yellow metal has made a entry in the week under slightly selling pressure but struggled to gather bearish momentum in the absence of significant fundamental drivers. The renewed USD strength in the second half of the week forced the pair to, once again, turn south.

Whereas Clarida said that he expects the conditions for raising interest rates to be met by the end of 2022. Along with that, Dallas Fed President Robert Kaplan argued that the Fed should start tapering asset purchases soon and do it in a gradual way.              

The major economic events deciding the movement of the pair in the next week are JOLTS Job Openings at Aug 09, Nonfarm Productivity at Aug 10, EIA Crude Oil Stocks Change, Federal Budget Balance at Aug 11, Initial Jobless Claims, WASDE Report at Aug 12 and Michigan Consumer Sentiment at Aug 13 for US.

XAU/USD Weekly outlook:

Technical View:

Last week’s high was 0.06% lower than the previous week. Maintaining high at 1831.6 and low at 1758.6 showed a movement of 730 pips.

In the upcoming week we expect XAU/USD to show a bearish trend. The Instrument is trading below the below the 200 Simple Moving Average and the MACD trades to the downside. A solid breakout below 1737.3 may open a clean path towards 1711.5 and may take a way down to 1664.3. Should 1810.2 prove to be unreliable resistance, the XAUUSD may raise upwards 1857.4 and 1883.2 respectively. In H4 chart double top pattern favors prospects of a bullish trend. Also to be noted shooting star formation exerts the expectation of downtrend for the pair.

Preference
Sell: 1763.5 target at 1712.3 and stop loss at 1789.9


Alternate Scenario
Buy: 1789.9 target at 1856.4 and stop loss at 1763.5

AUD/USD Weekly Forecast (09th August 2021 – 13th August 2021)

Fundamental view:

Aussie fell against greenback in the last week. The Reserve Bank has surprised the markets with its latest monetary policy which has impacted positively. The central bank left the cash rate at 0.1% which was expected, along with that the 3-year bond yield target at the same level. The central bank had decided to maintain its previous decision to reduce its weekly bond-buying in September to A$4 billion per week, at least until mid-November. Whereas Policymakers reiterated that they do not expect to raise the cash rate until at least 2024.

US Markit Composite PMI on 4th August and US Initial Jobless Claims on 5th August created downtrend whereas Australia Commonwealth Bank Manufacturing PMI on 2nd August and Australia Building Approvals monthly report on 3rd August created uptrend for the pair.

The major economic events deciding the movement of the pair in the next week are Australia NAB Business Confidence, US JOLTS Job Openings at Aug 09, US Nonfarm Productivity at Aug 10, Australia Westpac-MI Consumer Sentiment monthly report, Federal Budget Balance at Aug 11, US Initial Jobless Claims, US WASDE Report at Aug 12 and US Michigan Consumer Sentiment at Aug 13.

AUD/USD Weekly outlook:

Technical View:

Last week’s high was 0.18% higher than the previous week. Maintaining high at 0.7426 and low at 0.7328 showed a movement of 98 pips.

In the upcoming week we expect AUD/USD to show a bearish trend.  The currency pair is trading below the 200 Simple Moving Average and the MACD trades to the downside. A solid breakout below 0.7311 may open a clean path towards 0.7271 and may take a way down to 0.7213. Should 0.7409 prove to be unreliable resistance, the AUDUSD may raise upwards 0.7467 and 0.7507 respectively. In H4 chart diamond pattern breakout favors prospects of a bearish trend. Also to be noted bearish engulfing formation exerts the expectation of downtrend for the pair.

Preference
Sell: 0.7353 target at 0.7272 and stop loss at 0.7414


Alternate Scenario
Buy: 0.7414 target at 7506 and stop loss at 0.7353

USD/JPY Weekly Forecast (09th August 2021 – 13th August 2021)

Fundamental view:

The US dollar initially fell during the course of the week and then picked up and formed a bullish candle. The US dollar rally formed after U.S. Federal Reserve led markets to bring forward the likely timing of a policy tightening. The yen pair portrayed a strong recovery after the previous day in May, with the US dollar benefiting from a volatile mood . Japan has restriction due to corona virus spread and related lockdowns.

Japan Consumer Confidence Index on 2nd August and Japan Markit Services PMI on 4th August created downtrend whereas US ISM Non-Manufacturing Employment on 4th August and US Unemployment Rate on 6th August created uptrend for the pair.

The major economic events deciding the movement of the pair in the next week are Japan Adjusted Current Account, US JOLTS Job Openings at Aug 09, US Nonfarm Productivity at Aug 10, BoJ Corporate Goods Price Index monthly report, Federal Budget Balance at Aug 11, US Initial Jobless Claims, US WASDE Report at Aug 12 and US Michigan Consumer Sentiment at Aug 13.

USD/JPY Weekly outlook:

Technical View:

Last week’s high was 0.21% lower than the previous week. Maintaining high at 110.35 and low at 108.71 showed a movement of 164 pips.

In the upcoming week we expect USD/JPY to show a bullish trend. The currency pair is trading above the 100 Simple Moving Average and the MACD trades to the upside. A solid breakout above 110.80 may open a clean path towards 111.40 and may take a way up to 112.44. Should 109.16 prove to be unreliable support, the USDJPY may sink downwards 108.12 and 107.52 respectively. In H4 chart, Formation of falling wedge pattern indicates reversal of the trend creating prospects of a bullish trend Along with a bullish hammer formation braces our expectation.

Preference
Buy: 110.21 target at 111.64 and stop loss at 109.11


Alternate Scenario
Sell: 109.11 target at 107.53 and stop loss at 110.21