AUD/USD Weekly Forecast (02nd August 2021 – 06th August 2021)

Fundamental view:

Australian dollar has gone back and forth against the US dollar during course of the trading week. Even the broad US dollar weakness could not help the Aussie. The main cause for that is still linked to the pandemic. Australia passed 2020 without much economic pain, as the island country quickly closed its borders. But this strategy did not work and it opened borders with newzealand and then virus reentered and led to multiple regional lockdowns which weighed on the Australian economy whereas The US Federal Reserve met on Wednesday, and its announcement was disappointing. Amidst the prevailing dollar weakness, Aussie closed the week with a slight bullish candle.

US Dallas Fed Manufacturing Index report on 26th July and Australia Export Price Index quarterly report on 29th July created uptrend whereas US S&P/CS HPI Composite-20 yearly report on 27th July & Australia CPI on 28th July created downtrend for the pair.

The major economic events deciding the movement of the pair in the next week are US ISM Manufacturing PMI at Aug 02, RBA Interest Rate Decision at Aug 03, Retail Sales monthly report, US ADP Nonfarm Employment Change, US ISM Non-Manufacturing PMI at Aug 04, RBA Governor Lowe Speech, US Initial Jobless Claims at Aug 05 and US Nonfarm Payrolls at Aug 06.

AUD/USD Weekly outlook:

Technical View:

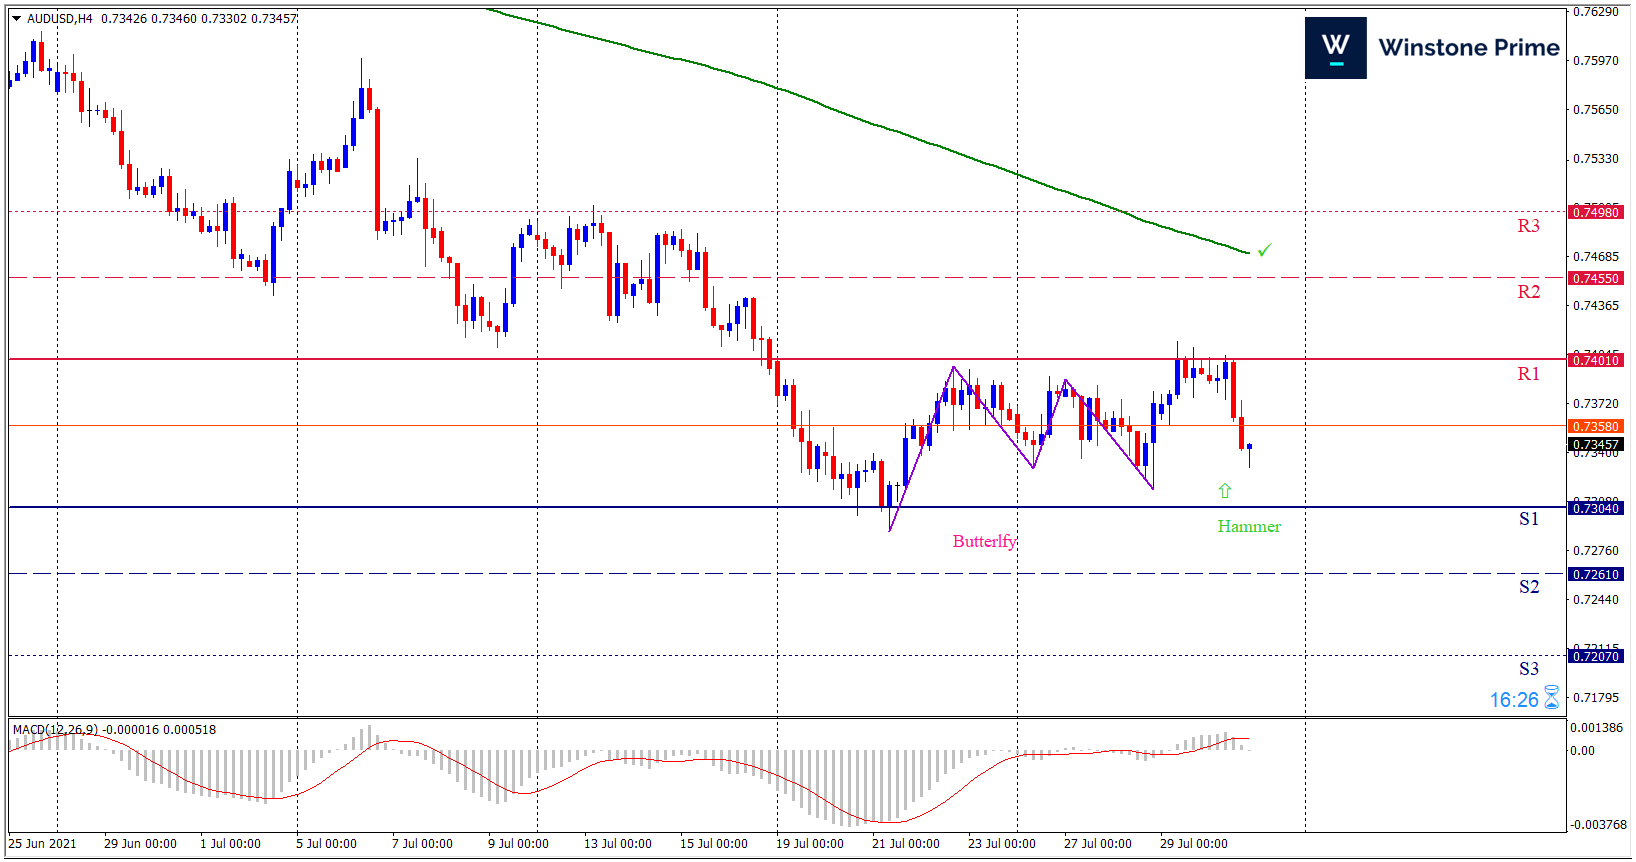
Last week’s high was 0.15% higher than the previous week. Maintaining high at 0.7413 and low at 0.7316 showed a movement of 97 pips.

In the upcoming week we expect AUD/USD to show a bullish trend.  The currency pair is trading below the 200 Simple Moving Average and the MACD trades to the upside. A solid breakout above 0.7401 may open a clean path towards 0.7455 and may take a way up to 0.7498. Should 0.7304 prove to be unreliable support, the AUDUSD may sink downwards 0.7261 and 0.7207 respectively. In H4 chart butterfly pattern favors prospects of a bullish trend. Also to be noted hammer formation exerts the expectation of uptrend for the pair.

Preference
Buy: 0.7359 target at 0.7454 and stop loss at 0.7295


Alternate Scenario
Sell: 0.7295 target at 0.7208 and stop loss at 0.7359

USD/JPY Weekly Forecast (02nd August 2021 – 06th August 2021)

Fundamental view:

The US dollar has fallen against the Japanese yen during the course of the week. The dollar was trading low due to weak US statistics and stationary monetary policy, there was no compelling reason to buy dollar whereas yen also seem to be unattractive with the absence of positive data. Comments from Japanese Prime Minister Yoshihide Suga on Friday came which stated Delta variant of the coronavirus is spreading quickly among the elderly struck a cautionary note on the country’s immediate economic future and US central bank left its monetary policy unchanged as expected.

Japan Coincident Index on 28th July & Japan Retail Sales yearly report on 30th July created uptrend whereas US New Home Sales on 26th July & US Initial Jobless Claims on 29th July created downtrend for the pair.

The major economic events deciding the movement of the pair in the next week are Japan Markit Manufacturing PMI, US ISM Manufacturing PMI at Aug 02, Japan 10-Year JGB Auction at Aug 03, US ADP Nonfarm Employment Change, US ISM Non-Manufacturing PMI at Aug 04, US Initial Jobless Claims at Aug 05 and US Nonfarm Payrolls at Aug 06.

USD/JPY Weekly outlook:

Technical View:

Last week’s high was same as the previous week. Maintaining high at 110.58 and low at 109.35 showed a movement of 123 pips.

In the upcoming week we expect USD/JPY to show a bearish trend. The currency pair is trading below the 200 Simple Moving Average and the MACD trades to the downside. A solid breakout below 109.14 may open a clean path towards 108.63 and may take a way down to 107.91. Should 110.37 prove to be unreliable resistance, the USDJPY may raise upwards 111.09 and 111.60 respectively. In H4 chart, Formation of inverted cup and handle pattern indicates reversal of the trend creating prospects of a bearish trend Along with a bullish shooting star formation braces our expectation.

Preference
Sell: 109.63 target at 108.64 and stop loss at 110.42


Alternate Scenario
Buy: 110.42 target at 111.59 and stop loss at 109.63

GBP/USD Weekly Forecast (02nd August 2021 – 06th August 2021)

Fundamental view:

The British pound has rallied significantly against greenback during the course of the week. The improving coronavirus situation in the UK, a strengthening economy and rising inflation has extended helping hand towards pound against greenback. On the other hand, US central bank left its monetary policy unchanged which was expected. In his press conference, Mr. Powell said that the withdrawal of monetary support has become an active topic among the governors. He also said that the US job market still had “some ground to cover” before the bank would begin the reduction of its $120-billion-a-month in purchases of Treasury and mortgage-backed securities.

Britain BoE Mortgage Approvals on 29th July & US Michigan Consumer Expectations on 30th July created downtrend whereas US New Home Sales on 26th July and Richmond Fed Services Revenues on 27th July created uptrend for the pair.

The major economic events deciding the movement of the pair in the next week are UK Markit/CIPS Manufacturing PMI, US ISM Manufacturing PMI at Aug 02, US ADP Nonfarm Employment Change, US ISM Non-Manufacturing PMI at Aug 04, BoE Interest Rate Decision, US Initial Jobless Claims at Aug 05 and US Nonfarm Payrolls at Aug 06.

GBP/USD Weekly outlook:

Technical View:

Last week’s high was 1.43% higher than the previous week. Maintaining high at 1.3983 and low at 1.3736 showed a movement of 247 pips.

In the upcoming week we expect GBP/USD to show a bullish trend.  The currency pair is trading above the 200 Simple Moving Average and the MACD trades to the upside. A solid breakout above 1.4013 may open a clean path towards 1.4122 and may take a way up to 1.4260. Should 1.3766 prove to be unreliable support, the GBPUSD may sink downwards 1.3628 and 1.3519 respectively. In H4 chart symmetrical triangle pattern breakout favors prospects of a bullish trend. Bullish engulfing pattern formation escalates the expectation for a bullish trend.

Preference
Buy: 1.3905 target at 1.4121 and stop loss at 1.3761


Alternate Scenario
Sell: 1.3761 target at 1.3522 and stop loss at 1.3905

EUR/USD Weekly Forecast (02nd August 2021 – 06th August 2021)

Fundamental view:

Euro traded high against the greenback in this week and reached July high. The US central bank left its monetary policy unchanged which was expected and the economy continued to progress but noted that “substantial further progress” toward the Fed’s goal of stable prices and maximum employment has not yet been achieved. “We are not there yet,” said Chairman Jerome Powell while asked him after the speech.

US Wholesale Inventories monthly report on 28th July & Europe Core CPI monthly report on 30th July created downtrend whereas Europe Ifo Business Climate on 26th July & Europe Jobseekers Total on 27th July created uptrend for the pair.

The major economic events deciding the movement of the pair in the next week are US ISM Manufacturing PMI at Aug 02, Europe Retail Sales monthly report, US ADP Nonfarm Employment Change, US ISM Non-Manufacturing PMI at Aug 04, ECB Economic Bulletin, US Initial Jobless Claims at Aug 05 and US Nonfarm Payrolls at Aug 06.

EUR/USD Weekly outlook:

Technical View:

Last week’s high was 0.66% higher than the previous week. Maintaining high at 1.1908 and low at 1.1763 showed a movement of 145 pips.

In the upcoming week we expect EUR/USD to show a bullish trend. The currency pair is trading above the 200 Simple Moving Average and the MACD trades to the upside. A solid breakout above 1.1932 may open a clean path towards 1.1992 and may take a way up to 1.2077. Should 1.1787 prove to be unreliable support, the EURUSD may sink downwards 1.1702 and 1.1642 respectively. Chart formation of a Semi – W pattern in H4 chart sets prospects for a bullish trend. Engulfing formation in H4 chart escalates the expectation for a bullish trend.

Preference
Buy: 1.1872 target at 1.1991 and stop loss at 1.1782


Alternate Scenario
Sell: 1.1782 target at 1.1643 and stop loss at 1.1872