GBP/USD Weekly Forecast (19th July 2021 – 23rd July 2021)

Fundamental view:

Pound fell against greenback in the last week. US Powell spoke regarding monetary policy. He said that inflationary pressures are likely to be temporary and pledged to maintain the financial support until the economy fully recovers. Meanwhile, Democrats presented a $3.5 trillion infrastructure package. On the other hand, In the UK, Prime Minister Boris Johnson insisted that the July 19 reopening would go through, despite the rapid spread of the Delta variant. Fears about increasing deaths and hospitalizations also pressured pound.

Britain CPI monthly report on 14th July and Britain Claimant Count Change on 15th July created an uptrend whereas US Federal Budget Balance on 13th July and US EIA Crude Oil Stocks Change on 14th July created a downtrend for the pair.

The major economic events deciding the movement of the pair in the next week are BoE MPC Member Haskel Speech at July 19, US Building Permits at July 20, US EIA Crude Oil Stocks Change at July 21, US Initial Jobless Claims, US CB Leading Economic Index monthly report at July 22, UK Retail Sales monthly report and US Markit Manufacturing PMI at July 23.

GBP/USD Weekly outlook:

Technical View:

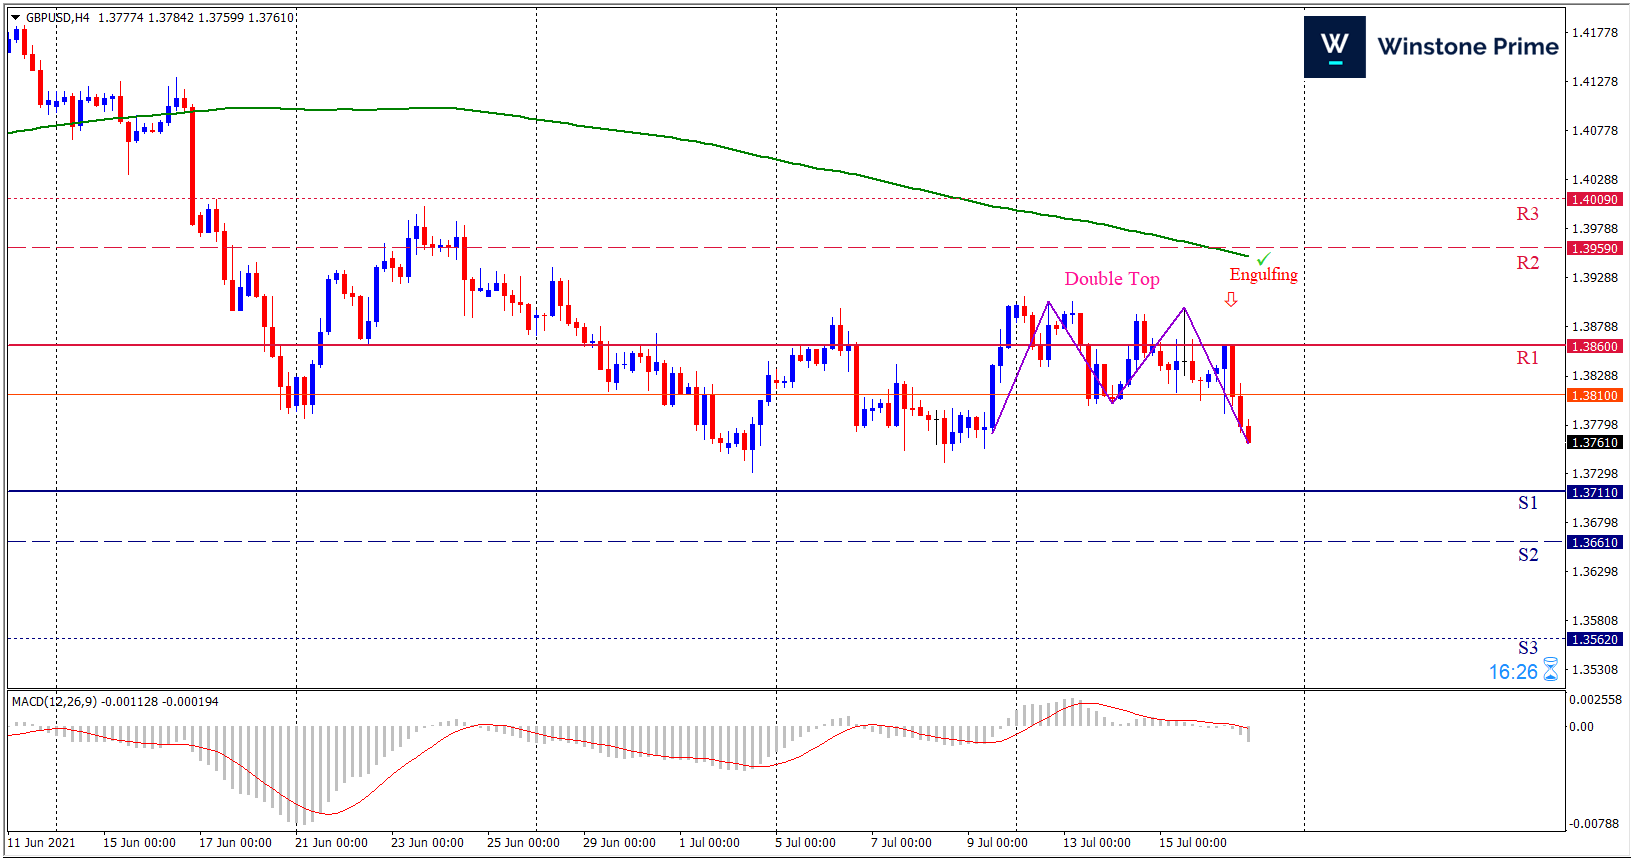
Last week’s high was 0.06% higher than the previous week. Maintaining high at 1.3909 and low at 1.3760 showed a movement of 149 pips.

In the upcoming week we expect GBP/USD to show a bearish trend.  The currency pair is trading below the 200 Simple Moving Average and the MACD trades to the downside. A solid breakout below 1.3711 may open a clean path towards 1.3661 and may take a way down to 1.3562. Should 1.3860 prove to be unreliable resistance, the GBPUSD may raise upwards 1.3959 and 1.4009 respectively. Chart formation of double top pattern in H4 chart favors prospects of a bearish trend. Bearish engulfing pattern formation escalates the expectation for a bearish trend.

Preference
Sell: 1.3764 target at 1.3662 and stop loss at 1.3865


Alternate Scenario
Buy: 1.3865 target at 1.4008 and stop loss at 1.3764

EUR/USD Weekly Forecast (19th July 2021 – 23rd July 2021)

Fundamental view:

The Euro has fallen during the week, as US dollar has strength this week. US Federal Reserve Chairman Jerome Powell testified before Congress on monetary policy. In his semi-annual presentation, he repeated that inflationary pressures are likely to be temporary and pledged to maintain the financial support until the economy fully recovers. European Central Bank President Christine Lagarde also gave comments on monetary policy. The ECB has decided to be flexible with inflation, announcing that the 2% target is not a benchmark but rather a level around which inflation could oscillate.

Europe CPI monthly report on 13th July and Europe Trade Balance n.s.a. on 16th July created a downtrend whereas Europe Wholesale Price Index monthly report on 12th July and US Business Inventories monthly report on 16th July created an uptrend for the pair.

The major economic events deciding the movement of the pair in the next week are US Building Permits at July 20, US EIA Crude Oil Stocks Change at July 21, ECB Interest Rate Decision, ECB Monetary Policy Press Conference, US Initial Jobless Claims, US CB Leading Economic Index monthly report at July 22 and US Markit Manufacturing PMI at July 23.  

EUR/USD Weekly outlook:

Technical View:

Last week’s high was 0.13% lower than the previous week. Maintaining high at 1.1880 and low at 1.1771 showed a movement of 109 pips.

In the upcoming week we expect EUR/USD to show a bearish trend. The currency pair is trading below the 200 Simple Moving Average and the MACD trades to the downside. A solid breakout below 1.1757 may open a clean path towards 1.1709 and may take a way down to 1.1648. Should 1.1866 prove to be unreliable resistance, the EURUSD may raise upwards 1.1927 and 1.1975 respectively. Chart formation of an inverted cup and handle pattern in H4 chart sets prospects for a bearish trend. Bearish Engulfing formation in H4 chart escalates the expectation for a bearish trend.

Preference
Sell: 1.1804 target at 1.1710 and stop loss at 1.1871


Alternate Scenario
Buy: 1.1871 target at 1.1974 and stop loss at 1.1804

Identifying Over trade or Under trade

Every trader should ultimately consider is how often they should trade. Do they do one trade a day, 100 or more a day? Determining the times of trading is likely to occur naturally, all traders should stop and evaluate how much they are trading, and if it is possible for them to undertake or overwrite a particular style or organization. Scalping styles generally require a lot of trades, while level traders need to be more selective in the movements in which they trade. Every style is different, and many or very few trades can be detrimental to a trader’s profit.

A trader should watch instances of undertrading or overtrading. Are traders giving up potential profits because they are not ready to enter a position when they see an opportunity or waste money on excessive fees? If a trader works, “My trading plan says I have to go in. I did not!” Or “Why didn’t I do that trade?” This is a clear sign. In this article we will explore about overtrading and undertrading and how to handle this?

Under Trading

Many traders are guilty of under trading. When this happens, an individual will not take as many trades as he or she should be taking. For example, a trader may look at the market and look at a potential trading opportunity. Instead of taking the trade, they ignore it. They might decide to avoid the opportunity because they have already reached a certain number of trades for the day. 

If you find yourself leaving potentially profitable trades on the table, there is a good chance that you are under trading. When this happens, you are leaving money in the markets that could be yours. If you find yourself asking why you didn’t take a trade, you are guilty of under trading. 

Overtrading

Many traders have some other problem is that they often trade too frequently. If this happened traders are going to find themselves in some precarious situations. Many times, traders will decide to randomly trade just so that they can be in the market. As a result of this, they often end up taking bad trades and losing a majority of them. Instead of trading just to trade, you should wait until there is a profitable opportunity to do so. If you find yourself trading just to be doing something, you are most likely overtrading.

Overtrading vs undertrading: what’s the difference?

Undertrading usually means that there is little or no trading activity even when there are opportunities to trade. Overtrading is the opposite of undertrading.  When traders don’t use their funds for an extended period, hold very small positions, or have very strict entry conditions, they may be at risk of undertrading. The biggest cause of undertrading is the fear of losing money. But, if you don’t trade, you could miss out on the right opportunities. Traders who have not set up a trading plan, and just watch market as they go, are also at risk of undertrading.

Personal Style

There is as such no particular number of trades for trader. You need to look at your preferences and try to develop a good number of trades to work on a regular basis. If you are looking the charts everytime you would like to trade often. If you are the type of individual that likes to place a trade and then do other things, you will most likely have a more passive trading style.

Use a Trading Plan

Every trader should have a trading plan. Entry and exit from stocks should not be random; there should be a reason behind each trade supported by the trading plan. Chances are, if a trader is overtrading or undertrading and a plan is in place, that plan needs tweaking. If traders are overtrading, they may need to make their entry and exit criteria more stringent or harder for the market to manufacture valid signals. 

When we add more criteria that need to be in place for a trade to happen, we will do fewer trades, but chances are that those trades will be more consistent and more profitable – although this is never a guarantee.

If a trader is undertrading, he will not have any such trading plan to be placed, so there is missing opportunities. If the trader does have a plan, the current criteria for entering a trade are likely too restrictive. If a plan does not allow the trader to capitalize on major movements, it should be adjusted so that the trader can take part in these moves. Do not cut off valid market opportunities because of a fear of losing. Develop a plan of attack for the markets. What needs to happen in order for you to enter a trade, and also what needs to happen for you to get out of a position?

The Bottom Line

All traders, regardless of how often they trade, should have a trading plan. After the trading plan is in place, we need to do a self-assessment of whether you are overtrading or undertrading within your plan. Based on these results, you can alter your trading plan to suit your needs and likely increase your profitability. If you are overtrading, you can make your trading plan more restrictive for entries and exits. If you are undertrading, you can relax your trading plan criteria to take advantage of potentially profitable moves in the market.

BOJ’s move weighs on Yen

USD/JPY pays attention on Bank of Japan’s (BOJ) monetary policy announcements, stays bullish moment on pair among early Friday. The reason could be traced to the US dollar’s sustained strength for its best weekly gain in about a month, supported by buying on investor worries about quicker U.S. interest rate increases and by rising virus infections, while a hot inflation reading lifted US Dollar and already expected move by the Japanese central bank.

The BOJ has kept the key policy rate at -10 basis points (bps) as it abides by its pledge to buy J-REITS up to JPY180 billion at an annual pace during the July monetary policy meeting. In doing so, the Japanese central bank told Reuters that “Japan’s economy is in a severe state, but is being taken as a trend.

On the other hand, a survey by credit-research firm Tokyo Shoko Research found that 34.2% of small and medium-sized enterprises with a capital of less than ¥100 million have a higher debt of their own, more than 15.4% of large firms. According to a survey conducted by credit-research firm Tokyo Shoko Research, 34.2% of small and medium-sized enterprises with a capital of less than ¥100 million have a higher debt of their own, more than 15.4% of large firms. Although sales of SMEs declined significantly, the number of corporate bankruptcies (for loans of 10 million or more) decreased by 22.2% year-on-year during the January-May period of 2021 to a total of 2,503 bankruptcies. However, business performance has not yet recovered, especially in the restaurant sector, resulting in excessive debt.

The rise of the corona virus has been a major catalyst in the wake of the market’s recent rush for risk protection. The Northern Hemisphere recently merged and, unfortunately, the League of Asia-Pacific region witnessed a multi-day high epidemic and rapid spread of the Govt variant. The UK recorded the highest number of daily cases since the previous day in January, and Tokyo’s epidemics were the highest in six months. Also, recalling the Los Angeles mask order extends Australia’s local lock downs.

As the BOJ met market expectations, USD/JPY traders will pay close attention to Governor Haruhiko Kuroda’s comments for immediate direction. Ahead on Friday, traders are looking to U.S. retail sales data and consumer confidence for any reading on inflation and the strength of the recovery. 

USD/JPY 4 Hour Chart:

Support: 109.67 (S1), 109.50 (S2), 109.29 (S3).

Resistance: 110.04 (R1), 110.25 (R2), 110.41 (R3).

Amidst this above catalysts yen is on downtrend and also another reason could be US dollar strength. We expect a bullish trend for USD/JPY.