Employment report impacts Aussie

Aussie is in the middle today following the vague signals of the Aussie employment report for June released early Thursday morning. Low market sentiment and US dollar recovery moves can be traced to this. Australia’s unemployment rate reached its lowest level in more than a decade in June, another sign of a significant economic recovery from the country’s epidemic and monetary policy tightening date.

The Australian Bureau of Statistics (ABS) data on Thursday showed that 29,000 net new jobs were created in June, which is in line with forecasts for 30,000 gains and over 115,100 in May. The increase rose to 51,600 from full-time jobs. Unemployment fell to 4.9 percent from 5.1 percent in May. This is the lowest level since December 2010, which extended a significant recovery from a high of 7.5% last July, as lockdown pushed the economy into recession.

In his two-year testimony, central bank chairman Jerome Powell sought to convince markets that the US Federal Reserve would make “a lot of announcements” before adjusting monetary policy. However, the strong U.S. Producer Price Index (PPI), ahead of the bullish Consumer Price Index (CPI), blinded traders to Powell’s comments. On the other hand, worsening Covid conditions in Australia are a major concern for Aussie traders amid delays in vaccine rolling and variation spread.

In addition to mixed employment figures, the sour mood of the markets also weighs on the risk-averse pair. Concerns about corona virus (COVID-19) strains and reflex fears are behind the sense of risk-free. AUD / USD traders, who witnessed the initial market reaction to the Aussie employment report, will keep their eyes peeled for new impetus on China’s data pipeline for June and Q2 GDP. However, risk catalysts are more likely to hold the driver’s seat.

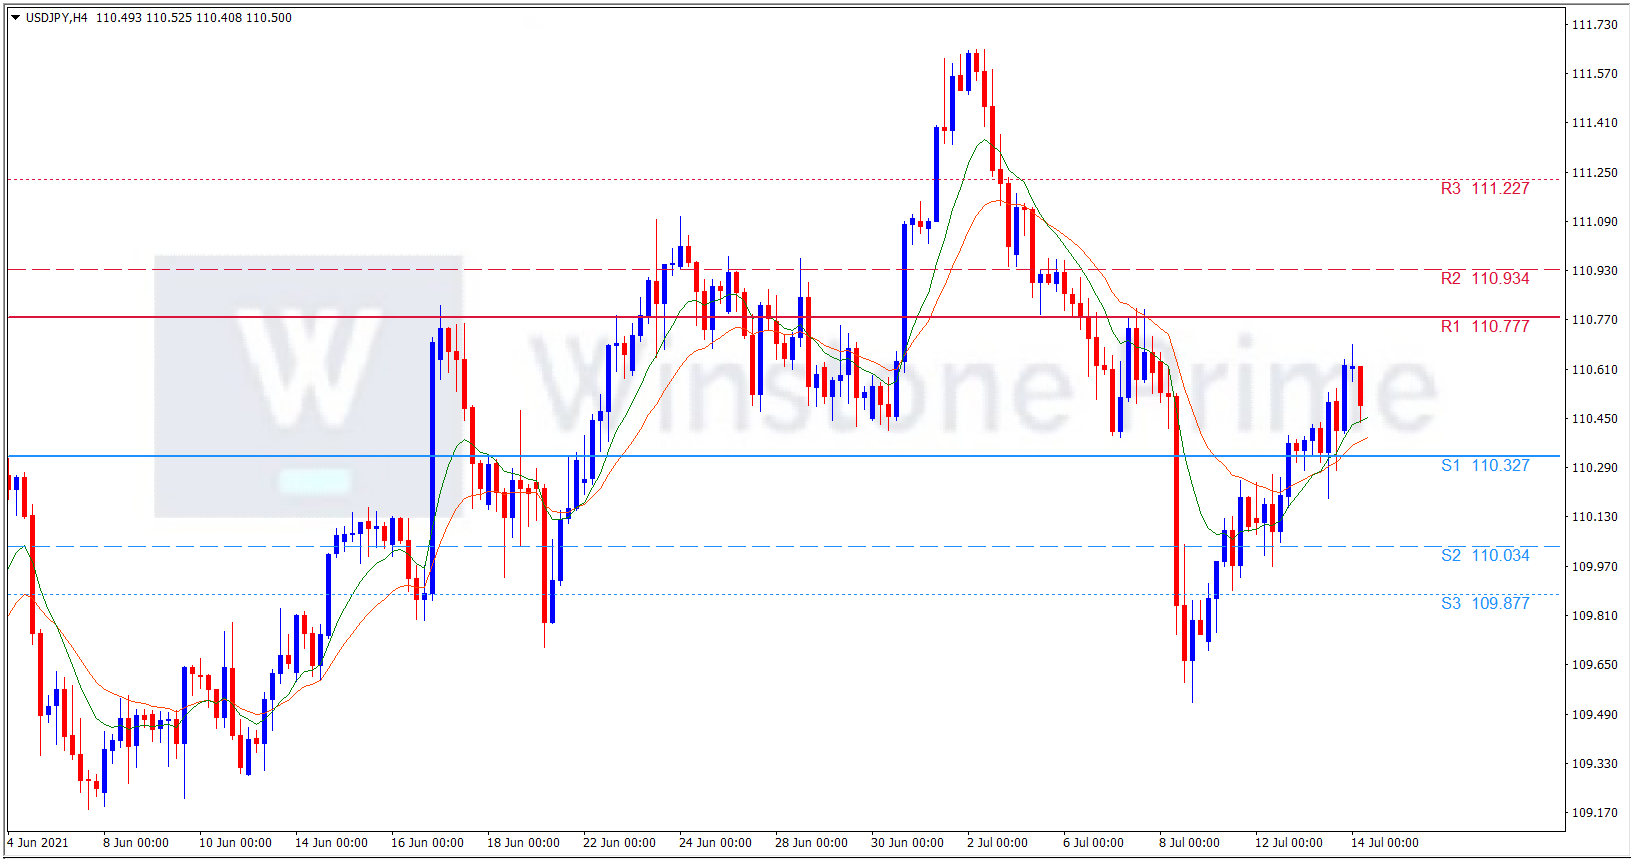
AUD/USD 4 Hour Chart:

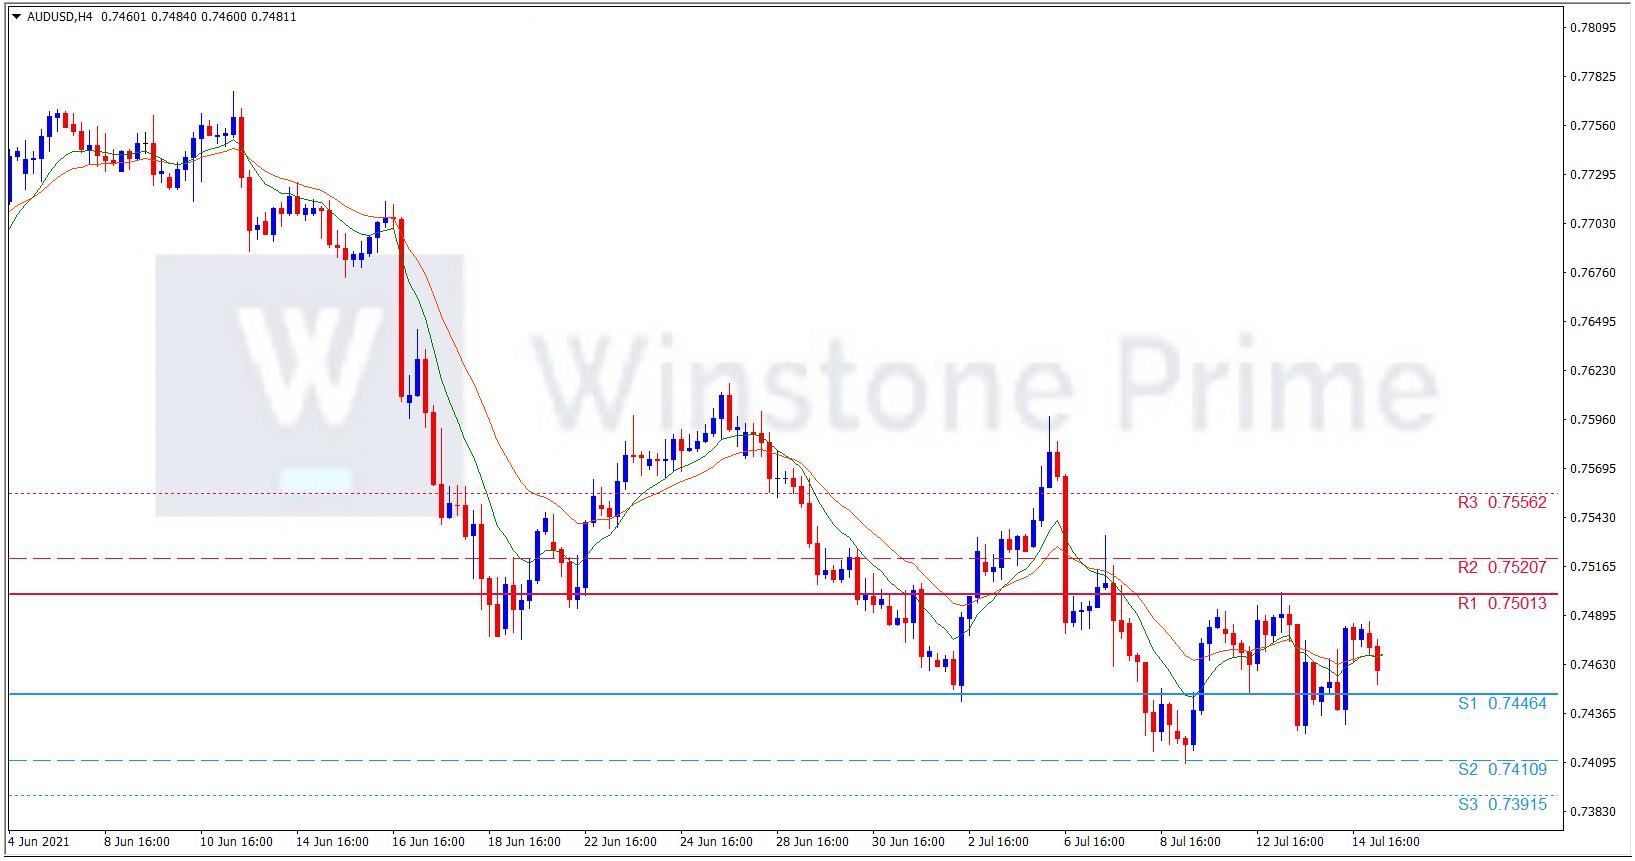
Support: 0.7446 (S1), 0.7411 (S2), 0.7392 (S3).

Resistance: 0.7501 (R1), 0.7521 (R2), 0.7556 (R3).

Amidst this overall above data plays driver’s seat on moment of AUD/USD pair. We expect mid-trend for AUD/USD.

Japan’s Business confidence impacts yen

U.S. Dollar were sidelined on trading ahead of a key report on producer price inflation and testimony by Federal Reserve Chairman Jerome Powell. Yesterday, Senate Democrats approved a $3.5 trillion investment plan, the U.S. announced plans for a new infrastructure investment. Senate Majority Leader Chuck Schumer said President Joe Biden’s drive was a boost and should be included in the budget resolution to be discussed soon. Schumer said the $ 3.5 trillion deal, which is yet to be approved by the 50-member Senate Democratic Alliance, includes a significant expansion of the Medicare program for the elderly – a key goal of budget committee chair Bernie Sanders.

Later in the session, investors will also have the opportunity to respond to an assessment of the latest Fed Beige book on economic conditions. Fed Powell will speak with Congress on Wednesdays and Thursdays on the update on monetary policy. Part of his job is to sell the central bank’s easier policies in the wake of a strong economy and increase inflation. Powell has vowed that the current position will remain the same until “significant progress” is made towards the central bank’s employment and inflation targets.

U.S. for June On the same day that inflation data showed warmer than expected, the USD/JPY strengthened, raising expectations that inflation worries would continue. U.S. Costs of travel-related services continued to rise in June as supply barriers and the pace of economic recovery accelerated over 13 years in June.

Business confidence of Japanese manufacturers rose for more than two and a half years in July as the country’s export-driven recovery recovered thanks to solid global demand, according to a Reuters Tongan poll. But in a worrying sign, as companies struggled with the fall of the corona virus crisis, the service sector sentiment is pessimistic that, according to the poll, the Bank of Japan (BOJ) is closely monitoring the Tankan quarterly survey.

Traders are now looking forward to Fed Jerome Powell testifying before Congress on Wednesday and Thursday for any signals of highest interest rates. Powell has repeatedly said that high inflation will be temporary, and that he expects the supply chains to normalize and change.

USD/JPY 4 Hour Chart:

Support: 110.33 (S1), 110.03 (S2), 109.88 (S3).

Resistance: 110.78 (R1), 110.93 (R2), 111.23 (R3).

Amidst this Japan business confidence survey and key report of U.S. producer inflation shows the sidelined trend. We expect mid trend for USD/JPY.

Backtest your Strategies in Demo Account

From 2020 to till now, forex is all the rage. The Covid-19 crisis continues to rage relentlessly, making its way into new countries and regions every day. Due to lockdown restrictions, millions of consumers have been confined to their homes with no income but Forex traders earn profit from their trades. From the most important and Benefits of Forex Trading platforms, You do not need lot of amount to start trading. You may access the real market at just $200. Demo accounts cost nothing, and they are indispensable for forex education. Simple to create, they allow you to learn in a simulator.

This article is suitable for novices and experts who want to test new strategies before opening live trades. We have given in depth explanation about how to back test your strategies in MT4 demo account. We hope this article will be beneficial for You.

The use of MT4 strategy tester

Before launching an expert advisor (EA) on a real account, it is important to test it on historical data to evaluate the performance of the trading system. MetaTrader4 trading software features a strategy tester that can simulate performance over a defined period of time. It is also possible to optimize the parameters of the EA to find the optimal settings of the strategy for each currency pair.

The reliability of MT4’s strategy tester is often criticized due to the inaccuracy of the data provided by brokers. Backtest results can therefore be approximate. Despite these shortcomings, a backtest with MT4 provides valuable information on past performance. The backtest is a necessary step before launching an EA on a demo account, and then on a real account.

The MT4 strategy Tester

To run a back test, open and log in to the MT4 trading platform. From the main menu, navigate to View then select Strategy Tester. This window allows you to configure the parameters of the backtest.

Select the parameters according to the available options: the choice of the EA, the currency pair, the chart’s time frame, the model (select “Every Tick” for greater accuracy), the dates of the test period, and visual mode in order to see the progress of the strategy in real-time on the chart.

You can optionally click on “Expert properties” to change some settings. In the “Testing” tab, you can define the account’s deposit amount and currency. The “Positions” field is not really useful. The second part of this tab is for the optimizer of the MT4 strategy.

In the “Input parameters” tab, you can change the parameters in the “Value” column. The remaining columns are used for the strategy optimizer.

Click on “initial value” in the strategy tester’s window to launch the test.

Interpreting the results of MT4 backtest

When testing is complete, you can access the results from the tabs at the bottom of the strategy tester’s window.

The report tab displays a detailed analysis of the results. You can save it by right-clicking on the table.

The quality of the modelling is an important element that allows you to verify the accuracy of the data used for the test. Generally, the quality does not exceed 90% unless you can afford to purchase very reliable data.

You can also analyze the results using the following tabs:

Performance graph

Transaction Details

The journal to see if there are any errors

Conclusion

Backtesting is a precious tool available in most trading platforms. It is mainly used to determine the effectiveness of a given trading strategy. With backtesting, they can test out the effectiveness of their strategies by applying them to the historical market data.  Dividing historical data into multiple sets to provide for in-sample and out-of-sample testing can provide traders with a practical and efficient means for evaluating a trading idea and system.

While traders may not be able to do that in real life, the ability to simulate certain levels in past economic data can help achieve almost the same effect. If the aftermath results show that the current trading strategy is paying off in the past, it will give traders more incentive to use the same strategy in real life.

Chinese data favors kiwi

The Kiwi pair has been edges higher on today Asian session upon the sentiment mood of US Dollar and Upbeat Chinese trade data.  U.S. Dollar find support rather than inflation data, investors are on the verge of whether the figures could provide traces of tapping and interest rate hikes. The dollar is driven by U.S. rate expectations, and it rose almost 2% since the Federal Reserve surprised markets – and removed major challenges over the dollar’s ground – by forecasting a rate hike sooner than expected in 2023. Data securities are also proliferating as investors see cracks in the recovery, and are taking the worst change from the central bank to the fact that it is likely to act fast enough to keep inflation low.

Meanwhile Kiwi gained post upbeat Chinese trade surplus data, which showed the pace of economic recovery in Asia-pacific’s largest economic power. The trade surplus came at USD 51.53 billion in June, much higher than the market consensus of USD 44.2 billion. Finance Minister Grant Robertson says the Government is keen to open up quarantine-free travel bubbles with other countries as vaccination rates rise. New Zealand has travel bubbles with Australia and the Cook Islands that are intended to allow for quarantine-free two-way travel, although the Australian bubble has been fraught with pauses.

New Zealand house prices continued to rocket higher in June despite central bank and government measures intended to cool property speculation. “The median national sales price of 820,000 New Zealand dollars ($573,000) was nearly 29% higher than a year earlier”, the Real Estate Institute said Tuesday. “An increase in home construction should boost supply of new properties, though builders are struggling to find the workers needed to keep the building boom going”, Mr. Couchman said.

Meanwhile investors are looking forward to the Reserve Bank New Zealand’s (RBNZ’s) interest rate decision, after Personal & Business Banking in New Zealand (ASB), Westpac and Bank of New Zealand (BNZ) economist projected the date in the previous week when the RBNZ  is expected to rise the official cash rate (OCR). For the Dollar Fed Chair Jerome Powell’s testimony at Congress from Wednesday will be closely watched for his response to the inflation figures and his tone on the recovery’s progress.

NZD/USD 4 Hour Chart:

Support: 0.6951 (S1), 0.6919 (S2), 0.6891 (S3).

Resistance: 0.7012 (R1), 0.7040 (R2), 0.7072 (R3).

Amid the overall circumstances play a major role in placing the Kiwi in upbeat moment. We expect bullish trend for NZD/USD.