AUD/USD Weekly Forecast (05th July 2021 – 09th July 2021)

Fundamental view:

The Australian dollar has fallen a bit during the course of the week. The Nonfarm payroll along with the Fed’s Robert Kalpan’s move favored the US dollar which is the main driver behind the bearish trend for the pair.

Australia RBA Private Sector Credit monthly report on 29th June and US Average Weekly Hours report on 2nd July created bullish trend whereas US Pending Home Sales monthly report on 30th June and US Construction Spending monthly report on 1st July created a bearish trend for the pair.

The major economic events deciding the movement of the pair in the next week are Australia Retail sales monthly report at July 05, RBA Interest Rate Decision, US ISM Non-Manufacturing PMI at July 06, FOMC Minutes at July 07, RBA Governor Lowe Speech, US Initial Jobless Claims, US EIA Crude Oil Stocks Change at July 08 and US Wholesale Inventories monthly report at July 09.

AUD/USD Weekly outlook:

Technical View:

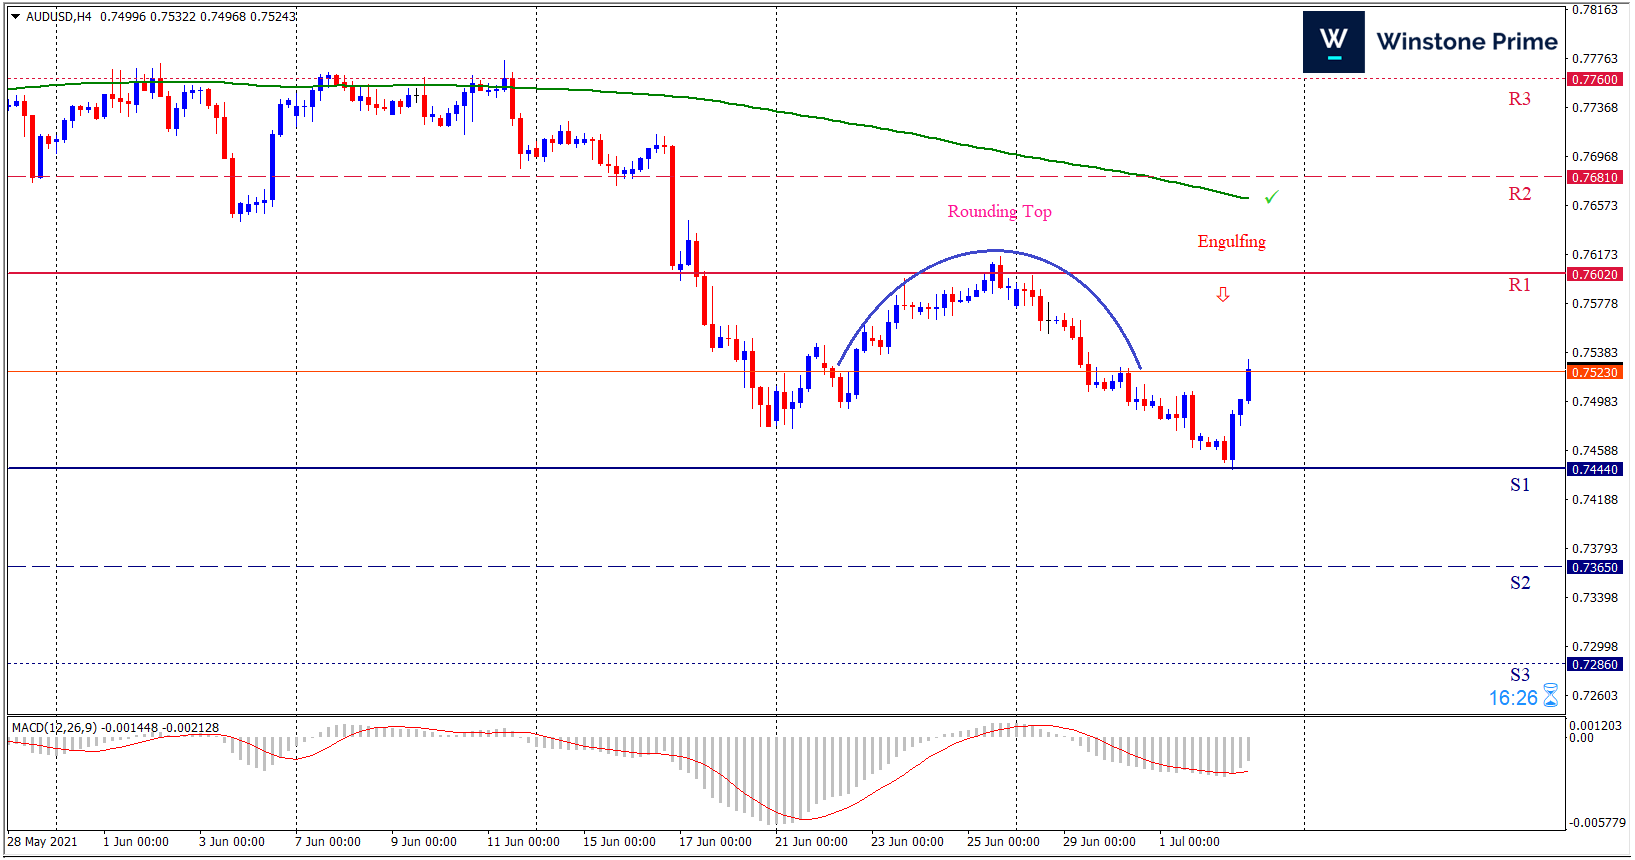
Last week’s high was 0.20% lower than the previous week. Maintaining high at 0.7601 and low at 0.7443 showed a movement of 158 pips.

In the upcoming week we expect AUD/USD to show a bearish trend.  The currency pair is trading below the 200 Simple Moving Average and the MACD trades to the downside. A solid breakout below 0.7444 may open a clean path towards 0.7365 and may take a way down to 0.7286. Should 0.7602 prove to be unreliable resistance, the AUDUSD may raise upwards 0.7681 and 0.7760 respectively. In H4 chart rounding top pattern formation favors prospects of a bearish trend. Also to be noted bearish engulfing formation exerts the expectation of downtrend for the pair.

Preference
Sell: 0.7521 target at 0.7366 and stop loss at 0.7607


Alternate Scenario
Buy: 0.7607 target at 0.7759 and stop loss at 0.7521

USD/JPY Weekly Forecast (05th July 2021 – 09th July 2021)

Fundamental view:

US dollar has rallied against the yen in the past week. The Japanese economic data was mixed with slightly better than forecast Retail Trade in April offset by a weaker than expected Tankan Manufacturing Survey for the second quarter. One bright spot was All Industry Capex (capital investment) which rose to 9.6% from 3% in the first quarter whereas US nonfarm payroll release was the trendsetter for the US dollar.

US Dallas Fed Manufacturing Index on 28th June and Japan Retail Sales yearly report on 29th June created bearish trend whereas Japan Industrial Production monthly report on 30th and US Pending Home Sales m/m & US EIA Crude Oil Stocks Change on 30th June created a bullish trend for the pair.

The major economic events deciding the movement of the pair in the next week are Japan Markit Services PMI at July 05, US ISM Non-Manufacturing PMI at July 06, FOMC Minutes at July 07, Japan Economy Watchers Index for Current Conditions, US Initial Jobless Claims, US EIA Crude Oil Stocks Change at July 08 and US Wholesale Inventories monthly report at July 09.

USD/JPY Weekly outlook:

Technical View:

Last week’s high was 0.49% higher than the previous week. Maintaining high at 111.65 and low at 110.41 showed a movement of 124 pips.

In the upcoming week we expect USD/JPY to show a bullish trend. The currency pair is trading above the 200 Simple Moving Average and the MACD trades to the upside. A solid breakout above 111.64 may open a clean path towards 112.26 and may take a way up to 112.88. Should 110.40 prove to be unreliable support, the USDJPY may sink downwards 109.78 and 109.16 respectively. In H4 chart, Formation of bullish butterfly pattern indicates reversal of the trend creating prospects of a bullish trend Along with a bullish engulfing formation braces our expectation.

Preference
Buy: 111.05 target at 112.24 and stop loss at 110.35


Alternate Scenario
Sell: 110.35 target at 109.17 and stop loss at 111.05

GBP/USD Weekly Forecast (05th July 2021 – 09th July 2021)

Fundamental view:

The Britain pound has made a fall against the greenback during the previous week. The biggest worry is the ongoing spread of the Delta variant of coronavirus, which may put a question on the already delayed reopening due on July 19. On the other hand, Along with favorable US data, Fed’s move also favored the dollar. Robert Kaplan, President of the Dallas branch of the Federal Reserve, is a known supporter of reducing the bank’s bond-buying scheme. He sounded the same comments and was joined by Fed Governor Christopher Waller. Amidst the entire catalysts dollar seems to be a king against pound.

US S&P/CS HPI Composite-20 n.s.a. monthly report on 29th June and US Continuing Jobless Claims on 1st July favored uptrend for the pair whereas Britain Nationwide HPI monthly report on 29th June and Britain GDP quarterly report on 30th June favored downtrend for the pair.

The major economic events deciding the movement of the pair in the next week are US ISM Non-Manufacturing PMI at July 06, UK Labour Productivity quarterly report, FOMC Minutes at July 07, US Initial Jobless Claims, US EIA Crude Oil Stocks Change at July 08 and UK Manufacturing Production monthly report, UK GDP monthly report, US Wholesale Inventories monthly report at July 09.

GBP/USD Weekly outlook:

Technical View:

Last week’s high was 0.44% lower than the previous week. Maintaining high at 1.3939 and low at 1.3730 showed a movement of 209 pips.

In the upcoming week we expect GBP/USD to show a bearish trend.  The currency pair is trading below the 200 Simple Moving Average and the MACD trades to the downside. A solid breakout below 1.3726 may open a clean path towards 1.3624 and may take a way down to 1.3517. Should 1.3935 prove to be unreliable resistance, the GBPUSD may raise upwards 1.4042 and 1.4144 respectively. Chart formation of bearish flag pattern in H4 chart favors prospects of a bearish trend. Bearish engulfing pattern formation escalates the expectation for a bearish trend.

Preference
Sell: 1.3832 target at 1.3625 and stop loss at 1.3940


Alternate Scenario
Buy: 1.3940 target at 1.4143 and stop loss at 1.3832

EUR/USD Weekly Forecast (05th July 2021 – 09th July 2021)

Fundamental view:

The Euro has fallen during the course of the trading week and ending with a bearish candle. Nonfarm Payroll release seems to have had one role in market favoring the greenback. The US gained more jobs than expected, 850,000. But moderate wage growth at 3.6% and the lack of substantial upward revisions were enough to trigger an upward move for dollar. Federal Reserve Governor Christopher Waller has reinforced those calling to decrease monetary policy support in response to the economic recovery. While Overall, Waller provided some support to the dollar. All the catalysts favored the greenback.

Europe Export Price Index yearly report on 28th June, US S&P/CS HPI Composite-20 n.s.a. monthly report on 29th June favored bullish trend whereas Europe PPI monthly report on 30th June and Europe US Factory Orders monthly report on 2nd July favored bearish trend for the pair.

The major economic events deciding the movement of the pair in the next week are Europe Retail Sales monthly report, Europe ZEW Economic Sentiment Indicator, US ISM Non-Manufacturing PMI at July 06, FOMC Minutes at July 07, US Initial Jobless Claims, ECB Monetary Policy Meeting Accounts, US EIA Crude Oil Stocks Change at July 08 and US Wholesale Inventories monthly report at July 09.

EUR/USD Weekly outlook:

Technical View:

Last week’s high was 0.26% lower than the previous week. Maintaining high at 1.1944 and low at 1.1806 showed a movement of 138 pips.

In the upcoming week we expect EUR/USD to show a bearish trend. The currency pair is trading below the 200 Simple Moving Average and the MACD trades to the downside. A solid breakout below 1.1797 may open a clean path towards 1.1733 and may take a way down to 1.1659. Should 1.1935 prove to be unreliable resistance, the EURUSD may raise upwards 1.2009 and 1.2073 respectively. Chart formation of an inverted cup and handle pattern in H4 chart sets prospects for a bearish trend. Harami formation in H4 chart escalates the expectation for a bearish trend.

Preference
Sell: 1.1869 target at 1.1734 and stop loss at 1.1940


Alternate Scenario
Buy: 1.1940 target at 1.2072 and stop loss at 1.1869