BTC/USD Weekly Forecast (28th Jun 2021 – 02nd July 2021)

Fundamental view:

Bitcoin has been falling against the greenback in the previous week. It has reached levels last seen almost a month ago. While the recovery has been slow for now, investors can expect an expedited run-up the following week.

However El Salvador’s news failed to catalyze Bitcoin price significantly, the developments around Bitcoin mining in China is about to have had a noticeable effect. Meanwhile the miners’ day-to-day functioning has been destabilized, many are moving to regulatory-friendly places.

Another news has joined in that Blockchain data platform Chainalysis said on Thursday it had raised $100 million in its latest funding round led by investment firm Coatue, taking its valuation to $4.2 billion.

The major economic events deciding the movement of the pair in the next week are CB Consumer Confidence Index at Jun 29, ADP Nonfarm Employment Change, EIA Crude Oil Stocks Change at Jun 30, Initial Jobless Claims, ISM Manufacturing PMI at July 01 and Nonfarm Payrolls at July 02 for US.

BTC/USD Weekly outlook:

Technical View:

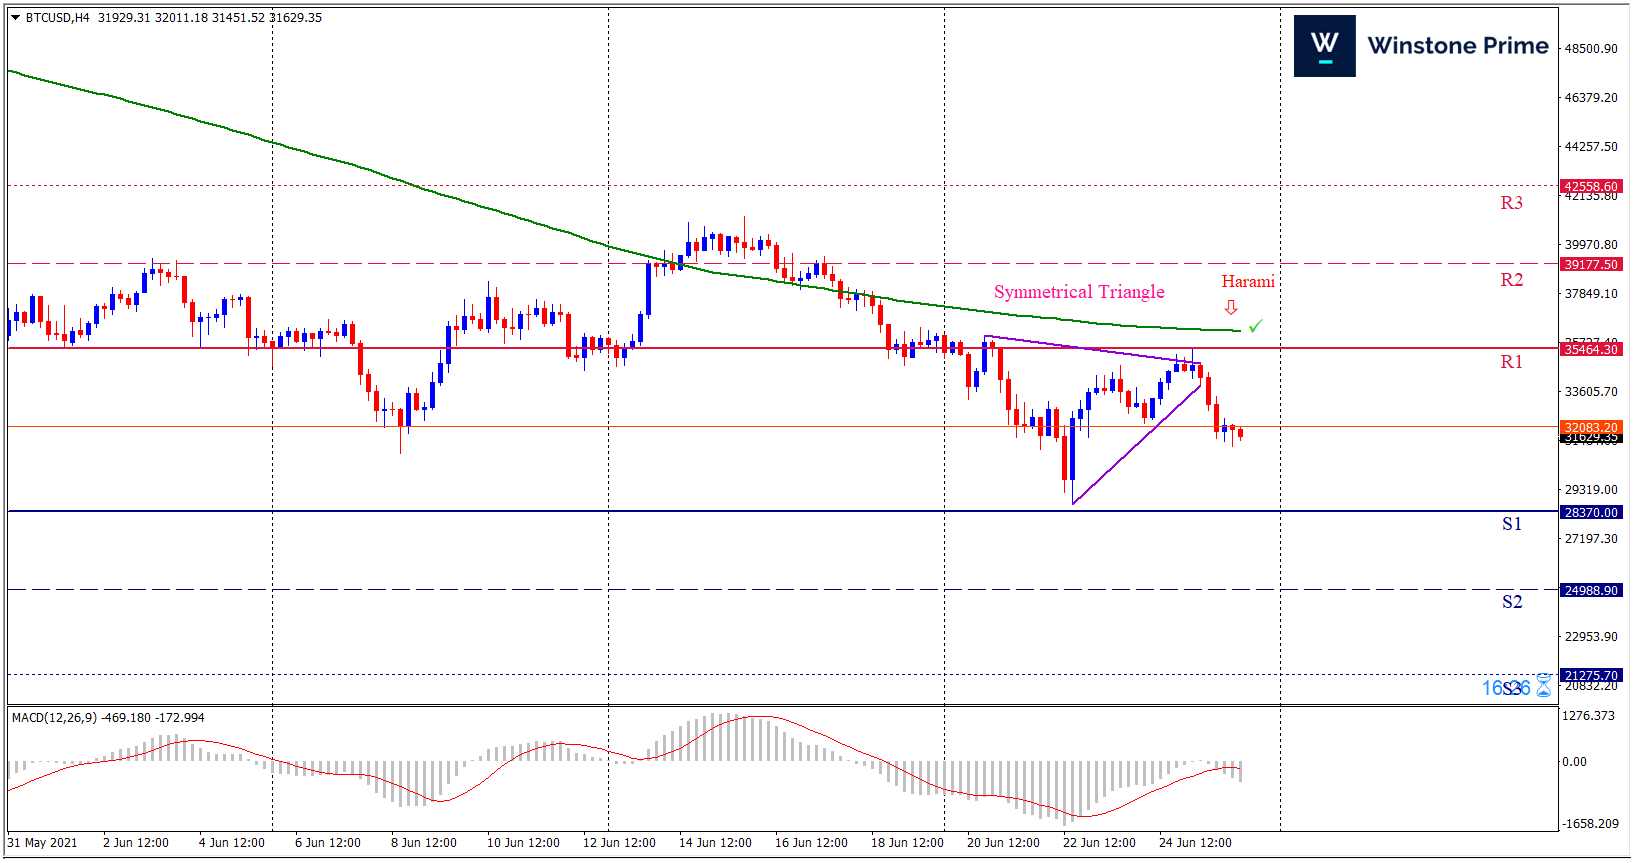
Last week’s high was 13.15% lower than the previous week. Maintaining high at 35796.4 and low at 28702.1 showed a movement of 7094 pips.

In the upcoming week we expect BTC/USD to show a bearish trend. The Instrument is trading below the 200 Simple Moving Average and the MACD trades to the downside. A solid breakout below 28370.0 may open a clean path towards 24988.9 and may take a way down to 21275.7. Should 35464.3 prove to be unreliable resistance, the BTCUSD may raise upwards 39177.5 and 42558.6 respectively. In H4 chart symmetrical triangle breakout favors prospects of a bearish trend. Bearish harami pattern constructs a bearish outlook for the pair in the upcoming week.

Preference
Sell: 32080.2 target at 24989.7 and stop loss at 35469.3


Alternate Scenario
Buy: 35469.3 target at 42557.6 and stop loss at 32080.2

XAU/USD Weekly Forecast (28th Jun 2021 – 02nd July 2021)

Fundamental view:

Gold traded high compared to greenback in the previous week. In the absence of high-tier macroeconomic data releases and fundamental developments, the USD’s market valuation drove XAU/USD’s movements at the initial of the week.

On the other hand while testifying before the House Select Subcommittee on the Coronavirus Crisis, Powell adopted a less-concerned tone with regards to price pressures and said that a substantial part of the overshoot in inflation was from categories directly affected by reopening.

“We’ve seen a lot of volatility and a lot of drivers, like the Fed going back and forth,” said Gainesville Coins precious metals expert Everett Millman.              

The major economic events deciding the movement of the pair in the next week are CB Consumer Confidence Index at Jun 29, ADP Nonfarm Employment Change, EIA Crude Oil Stocks Change at Jun 30, Initial Jobless Claims, ISM Manufacturing PMI at July 01 and Nonfarm Payrolls at July 02 for US.

XAU/USD Weekly outlook:

Technical View:

Last week’s high was 4.40% lower than the previous week. Maintaining high at 1794.8 and low at 1763.9 showed a movement of 309 pips.

In the upcoming week we expect XAU/USD to show a bullish trend.  The Instrument is trading below the 200 Simple Moving Average and the MACD trades to the upside. A solid breakout above 1796.0 may open a clean path towards 1810.9 and may take a way up to 1826.9. Should 1765.1 prove to be unreliable support, the XAUUSD may sink downwards 1749.1 and 1734.2 respectively. In H4 chart shark pattern formation favors prospects of a bullish trend. Also to be noted Bullish engulfing formation exerts the expectation of uptrend for the pair.

Preference
Buy: 1781.6 target at 1809.4 and stop loss at 1760.2


Alternate Scenario
Sell: 1760.2 target at 1735.6 and stop loss at 1781.6

AUD/USD Weekly Forecast (28th Jun 2021 – 02nd July 2021)

Fundamental view:

The Australian dollar has rallied a bit during the course of the week The macroeconomic data coming from major economies indicated sustained growth, regardless if it missed or surpassed the market’s expectations. Central bankers from around the developed world are showing different degrees of optimism regarding the post-pandemic comeback, which is underway.

Australia Retail Sales monthly report on 21st June and Commonwealth Bank Manufacturing PMI on 23rd June favored bearish trend whereas US Existing Home Sales on 22nd June and US PCE Price Index yearly report on 25th June favored bullish trend for the pair.

The major economic events deciding the movement of the pair in the next week are US CB Consumer Confidence Index at Jun 29, RBA Private Sector Credit monthly report, US ADP Nonfarm Employment Change at Jun 30, Australia Trade Balance, US Initial Jobless Claims, US ISM Manufacturing PMI at July 01 and US Nonfarm Payrolls at July 02.

AUD/USD Weekly outlook:

Technical View:

Last week’s high was 1.41% lower than the previous week. Maintaining high at 0.7616 and low at 0.7477 showed a movement of 139 pips.

In the upcoming week we expect AUD/USD to show a bearish trend.  The currency pair is trading below the 200 Simple Moving Average and the MACD trades to the downside. A solid breakout below 0.7507 may open a clean path towards 0.7423 and may take a way down to 0.7368. Should 0.7646 prove to be unreliable resistance, the AUDUSD may raise upwards 0.7701 and 0.7785 respectively. In H4 chart bearish bat pattern formation favors prospects of a bearish trend. Also to be noted bearish harami formation exerts the expectation of downtrend for the pair.

Preference
Sell: 0.7589 target at 0.7476 and stop loss at 0.7651


Alternate Scenario
Buy: 0.7651 target at 0.7784 and stop loss at 0.7589

USD/JPY Weekly Forecast (28th Jun 2021 – 02nd July 2021)

Fundamental view:

The US dollar has gone back and forth against the yen during the course of the trading week. This is because there is a bit of confusion in the market as the market is likely to continue to see a lot of questions asked about the Federal Reserve, especially as the Core PCE number came out just a little bit lighter than anticipated. Overall greenback traded somewhat high compared to yen.

US GDP Sales quarterly report on 24th June and US PCE Price Index yearly report on 25th June created bearish trend whereas US Chicago Fed National Activity Index on 21st June and Japan Markit Manufacturing PMI on 23rd June created bullish trend for the pair.

The major economic events deciding the movement of the pair in the next week are Japan Retail Sales monthly report at Jun 28, US CB Consumer Confidence Index at Jun 29, BoJ Tankan Large Manufacturing Index, US ADP Nonfarm Employment Change at Jun 30, US Initial Jobless Claims, US ISM Manufacturing PMI at July 01 and US Nonfarm Payrolls at July 02.

USD/JPY Weekly outlook:

Technical View:

Last week’s high was 0.26% higher than the previous week. Maintaining high at 111.11 and low at 109.71 showed a movement of 140 pips.

In the upcoming week we expect USD/JPY to show a bullish trend. The currency pair is trading above the 200 Simple Moving Average and the MACD trades to the upside. A solid breakout above 111.36 may open a clean path towards 111.93 and may take a way up to 112.76. Should 109.96 prove to be unreliable support, the USDJPY may sink downwards 109.13 and 108.56 respectively. In H4 chart, Formation of Inverted ascending scallop pattern indicates reversal of the trend creating prospects of a bullish trend Along with a bullish engulfing formation braces our expectation.

Preference
Buy: 110.75 target at 111.92 and stop loss at 109.91


Alternate Scenario
Sell: 109.91 target at 108.57 and stop loss at 110.75