Japan factory activity pressurises yen

The Japan Market see the pressure after the release of Japan factory activity data and BOJ Minutes. Japan’s factory activity expanded at the slowest pace in four months in June, which is a sign momentum in the world’s third-largest economy was levelling out before Tokyo is set to host the Olympic Games next month. Activity for the private sector as a whole contracted for a second straight month due to the weaker reading for manufacturing and continued shrinking in the services sector, clouding the outlook for second-quarter economic growth in the country.

The au Jibun Bank Flash Japan Manufacturing Purchasing Managers’ Index (PMI) had a fall to a seasonally adjusted 51.5 in June from a final 53.0 in the previous month, largely due to a sharp decline in output. Output shrank at the quickest rate since last November, the PMI survey showed, underscoring the pressure Japanese firms were facing from restrictions which is put in place in response to the health crisis.

Elsewhere, the Overall orders and export orders expanded, but at a most weaker pace than in the previous month, the survey showed. But manufacturers’ optimism for the year ahead stayed largely intact on hopes that Japan’s delayed vaccine roll-out would lead to an easing of coronavirus restrictions and fuel an economic recovery.

On the other hand Bank of Japan board members agreed that the massive stimulus measures deployed by advanced nations may help quicken the pace of recovery in the Japanese and global economies, minutes of their April policy-setting meeting showed on Wednesday. Japan will keep monetary settings unchanged for the time being, in the hope its ultra-loose policy and coronavirus pandemic-relief programmes will sustain a moderate recovery.

“There is uncertainty over the pace and effect of coronavirus vaccinations, which could heighten downward pressure on economic activity,” board member said in the meeting “But there’s a chance the stimulus measures taken by advanced nations could quicken the pace of recovery in domestic and overseas economies.” At the April meeting, the BOJ kept monetary settings intact and projected that inflation will miss its 2% target well beyond Governorer Haruhiko Kuroda’s current term ending in 2023.

USD/JPY 4 Hour Chart:

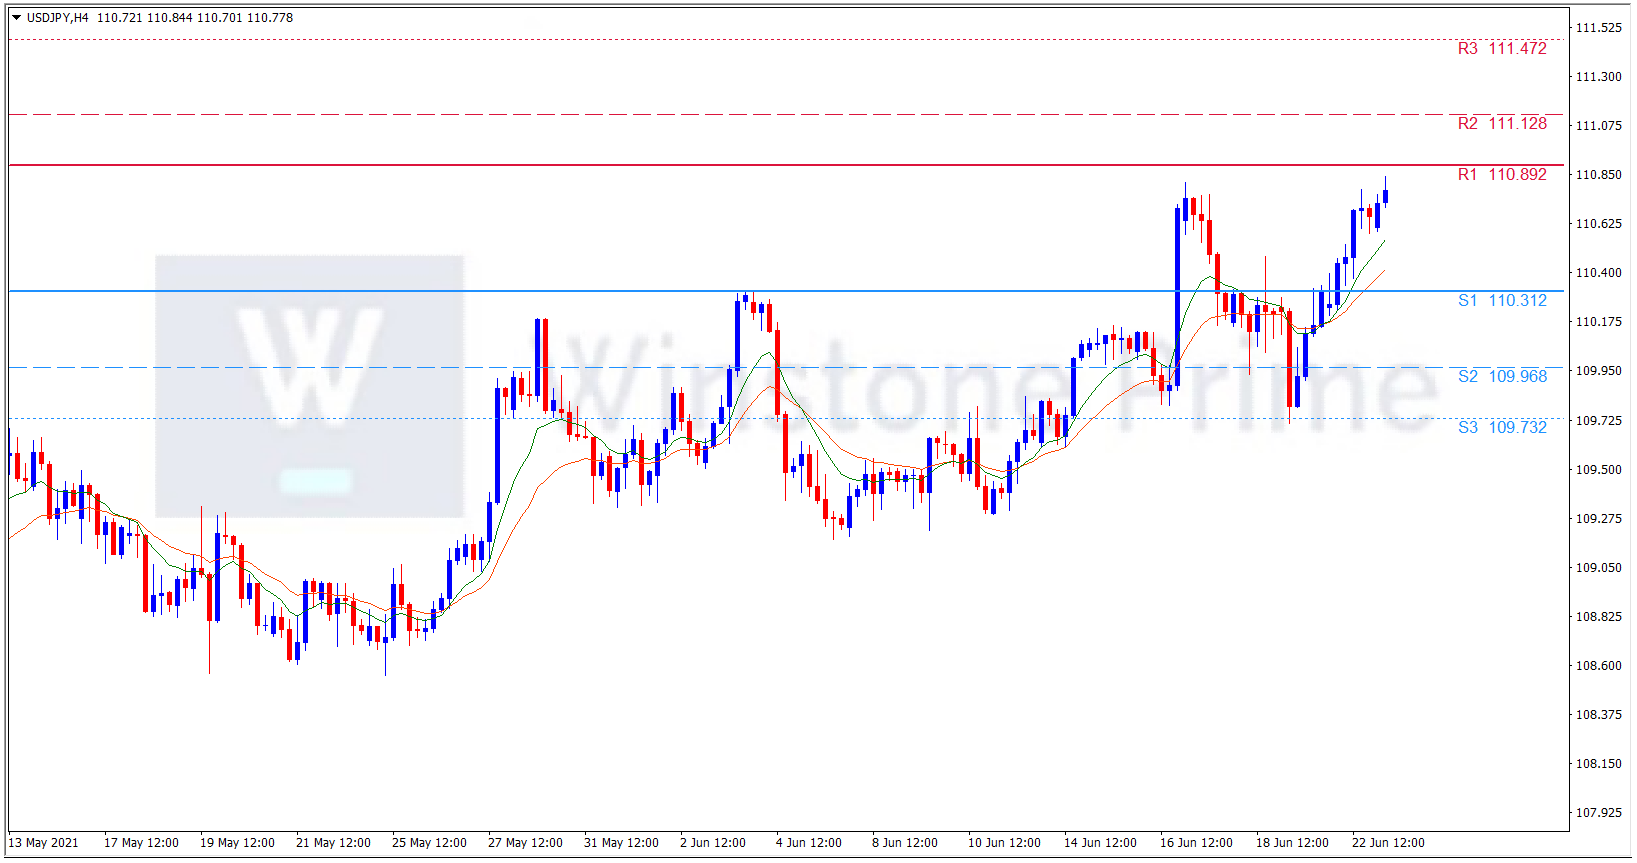
Support: 110.31 (S1), 109.97 (S2), 109.73 (S3).

Resistance: 110.89 (R1), 111.13 (R2), 111.47 (R3).

All the above catalyts are putting the yen under pressure. We expect a bullish trend for USD/JPY.

Weekly time frame in Forex Trading

One of the main reasons why most Forex traders lose money is a failure to trade based upon longer-term, higher time frames such as the weekly time frame. Weekly timeframe is very effective in Forex trading. It cuts out a lot of noises on lower timeframes and give a much better picture of the medium term or even long term trends.

Weekly time frame takes a lot of patience (couple of weeks to months) for trades to develop in weekly timeframe because of which people who are mostly impatient, cannot utilize or trade on this with discipline. In forex, the support and resistance levels on Weekly timeframes are much better respected than on hourly or daily timeframes.

This article explains why and how to use the weekly time frame in your Forex trading, and outlines both rules and actual historical performances of a few weekly time frame trading strategies which you might use or adapt.

What is Time Frame in Forex Trading?

“Time frame” in Forex trading means the unit of time that the price chart you are viewing is based on. For example, in a weekly time frame Japanese candlestick chart, each candlestick represents one week of time. In a 5-minute time frame Japanese candlestick chart, each candlestick represents 5 minutes of time. 

Shorter time frames show much more detail of price movement over time, but longer time frames show wider, longer-term pictures of trends and ranges in the price.

Why You Should Use the Weekly Time Frame in Forex Trading 

Weekly time frame in Forex Trading - 3

The most effective, profitable, and powerful tool you can use to trade Forex is to pay attention to whether or not there is a long-term trend or range in any currency pairs or crosses, especially the major pairs; and if so, in which direction that trend is going. 

Then, make sure that you trade in the same direction as that trend, or trade reversals from support and resistance when there is no trend and the price is ranging. Use a higher time frame price chart such as the weekly time frame to make these calls.

While you can use a daily time frame chart for the same purpose, you should use the weekly time frame in Forex trading for this because it is easier to judge the very long-term price action at a glance there. It is also a good idea to drill down and use at least one shorter time frame chart as well, such as the 4 hour or hourly time frames, to fine-tune your trade entries and exits to make them more precise, which also means more profitable.

Advantages of Weekly Time Frame

Weekly time frame has its own advantages.. A weekly time frame gives you a broader scope of what is happening in the market and shows five times more price action than that of the daily time frame. Usually, the longer time frames have more accuracy when it comes to technical analysis. There are some specific strategies that can used for such long time frames such as weekly and monthly.

For novices, We would recommend 1 hour, 4 hour and daily time frames.. Weekly time frames may be too long for beginners. Since learning is very important, sticking to a time frame like 1 hr or 4 hr gives you more opportunity for some learning and experience.

  • Identify whether there is a long-term trend or range in a currency pair or cross by checking price moves over last 3 and 6 months.
  • Identify the direction of the long-term trend if there is one and trade it.
  • Drill down to lower time frames to fine-tune your trade entries.
  • Trade reversals from support and resistance when there is no trend and the price is ranging.


Buying dips in trends is usually more profitable than trading breakouts in Forex.

A general rule is that the longer the time frame, the more reliable the signals being given. As you drill down in time frames, the charts become more polluted with false moves and noise. Ideally, traders should use a longer time frame to define the primary trend of whatever they are trading. Once the underlying trend is defined, traders can use their preferred time frame to define the intermediate trend and a faster time frame to define the short-term trend. Some examples of putting multiple time frames into use would be:

A swing trader, who focuses on daily charts for decisions, could use weekly charts to define the primary trend and 60-minute charts to define the short-term trend.

A day trader could trade off of 15-minute charts, use 60-minute charts to define the primary trend and a five-minute chart (or even a tick chart) to define the short-term trend.

A long-term position trader could focus on weekly charts while using monthly charts to define the primary trend and daily charts to refine entries and exits.

The selection of what group of time frames to use is unique to each individual trader. Ideally, traders will choose the main time frame they are interested in, and then choose a time frame above and below it to complement the main time frame. As such, they would be using the long-term chart to define the trend, the intermediate-term chart to provide the trading signal and the short-term chart to refine the entry and exit. One note of warning, however, is to not get caught up in the noise of a short-term chart and over analyze a trade. Short-term charts are typically used to confirm or dispel a hypothesis from the primary chart.

Conclusion

By taking the time to analyze weekly time frames, traders can greatly increase their odds for a successful trade. Becoming a successful Forex trader is all about putting the clues together in a way that gives you the upper hand. If you aren’t currently paying attention to the weekly time frame you aren’t getting a complete picture of what the market is doing. This limited visibility will hinder your ability to properly analyze a trade setup which can put you at an immediate disadvantage.

ECB’s Monetary decision favors Gold

Gold price is trading up from yesterday as the U.S. traded on a corrective and short-covering rebound on Monday after dropping sharply last week and made hit of five-week low on Friday.

The market sentiment continues to move indicating about inflation prospects after the previous week’s hawkish monetary policy tone from the Federal Reserve. Many economic indicators are pointing towards stronger potential for higher inflation creating problems but one major indicator does not: U.S. Treasury yields.

The yield on the benchmark U.S. 10-year Treasury note is fetching 1.43% Monday morning. Which is lower than the yield on the 10-year note that was seen prior to last Wednesday’s FOMC meeting results. Mean while the greenback has gained sharply since the Fed last week flagged sooner-than-expected interest rate hikes, but dipped on Monday to hand back a little bit of that rise.

Gold market is also finding some support from the European Central Bank (ECB) as its president Christine Lagarde repeated that the central bank’s stance that it is not ready to think on tightening its monetary policy anytime soon. Testifying before the European Parliament’s Committee on Economic and Monetary Affairs, Lagarde said that the ECB will continue to maintain its ultra-loose monetary policies as it is prepared to see through current inflation pressures.

Elsewhere, Many gold analysts have been getting excited about the prospect of strong physical demand coming to the v market as banks holding the precious metal will have to meet new funding ratio requirements under the Basel III agreements. In the medium term, investors will be keenly focused on the U.S. labour market as its performance is likely to have an influence on the Fed’s attitude. In the nearer future, all eyes are on Powell who appears before Congress from 1800 GMT.

XAU/USD 4 Hour Chart:

Support: 1769.2 (S1), 1755.3 (S2), 1746.7 (S3).

Resistance: 1791.7 (R1), 1800.3 (R2), 1814.3 (R3).

Higher inflation and bit ECB Monetary decision favors the gold market. We expect a bullish trend for XAUUSD.

Aussie ignores downbeat retail sales

Aussie is not effected by the downbeat Aussie data. In doing so, the Aussie pair keeps the early Asian recovery moves, amid the broad US dollar pullback.

Australia’s reading of May’s Retail Sales has came below 0.7% forecast and 1.1% MoM prior to 0.1%, making the market fear of the negative economic impact of Victoria’s snap lockdown. Adding to it People’s Bank of China’s (PBOC) decision to keep the benchmark interest rate unchanged near 3.85% even though recently there is the pause in the further easy monetary policy.

Along with the US dollar’s consolidation of the recent gains, coupled with downbeat bond yields pressurises the us dollar.

AUD/USD pair ignores downbeat market sentiment also the chatters relating to the Pacific major’s push to the World Trade Organization (WTO) for saving it from China’s tariffs. On the other hand, there could be the global fears of the covid’s Delta variant and uncertainty over US President Joe Biden’s infrastructure and spending package.

AUD/USD 4 Hour Chart:

Support: 0.7451 (S1), 0.7423 (S2), 0.7369 (S3).

Resistance: 0.7533 (R1), 0.7588 (R2), 0.7615 (R3).

After ignoring the retail dsles data, AUD/USD traders will keep their eyes on the Fedspeak and Chicago Fed National Activity Index for May, prior 0.24, for fresh impulse. In the meantime, we expect a neutral trend for Aud/usd.