BTC/USD Weekly Forecast (21st Jun 2021 – 25th Jun 2021)

Fundamental view:

Bitcoin fell against greenback in the last week. The U.S. Federal Reserve updated their inflation expectations for this year from 2.4% in March to 3.4% in their latest meeting that concluded on June 16. To tame inflation, the Fed plans to undertake two rate hikes before the end of 2023. Elsewhere Pantera Capital chief executive Dan Morehead said in the monthly newsletter published on June 14 that Bitcoin has been “this “cheap” relative to its trend 20.3% of the past 11 years.”

The major economic events deciding the movement of the pair in the next week are FOMC Member Williams Speech at Jun 21, Fed Chair Powell Testimony at Jun 22, Markit Manufacturing PMI, EIA Crude Oil Stocks Change at Jun 23, GDP quarterly report, Core Durable Goods Orders, Initial Jobless Claims at Jun 24 and Core PCE Price Index at Jun 25 for US.

BTC/USD Weekly outlook:

Technical View:

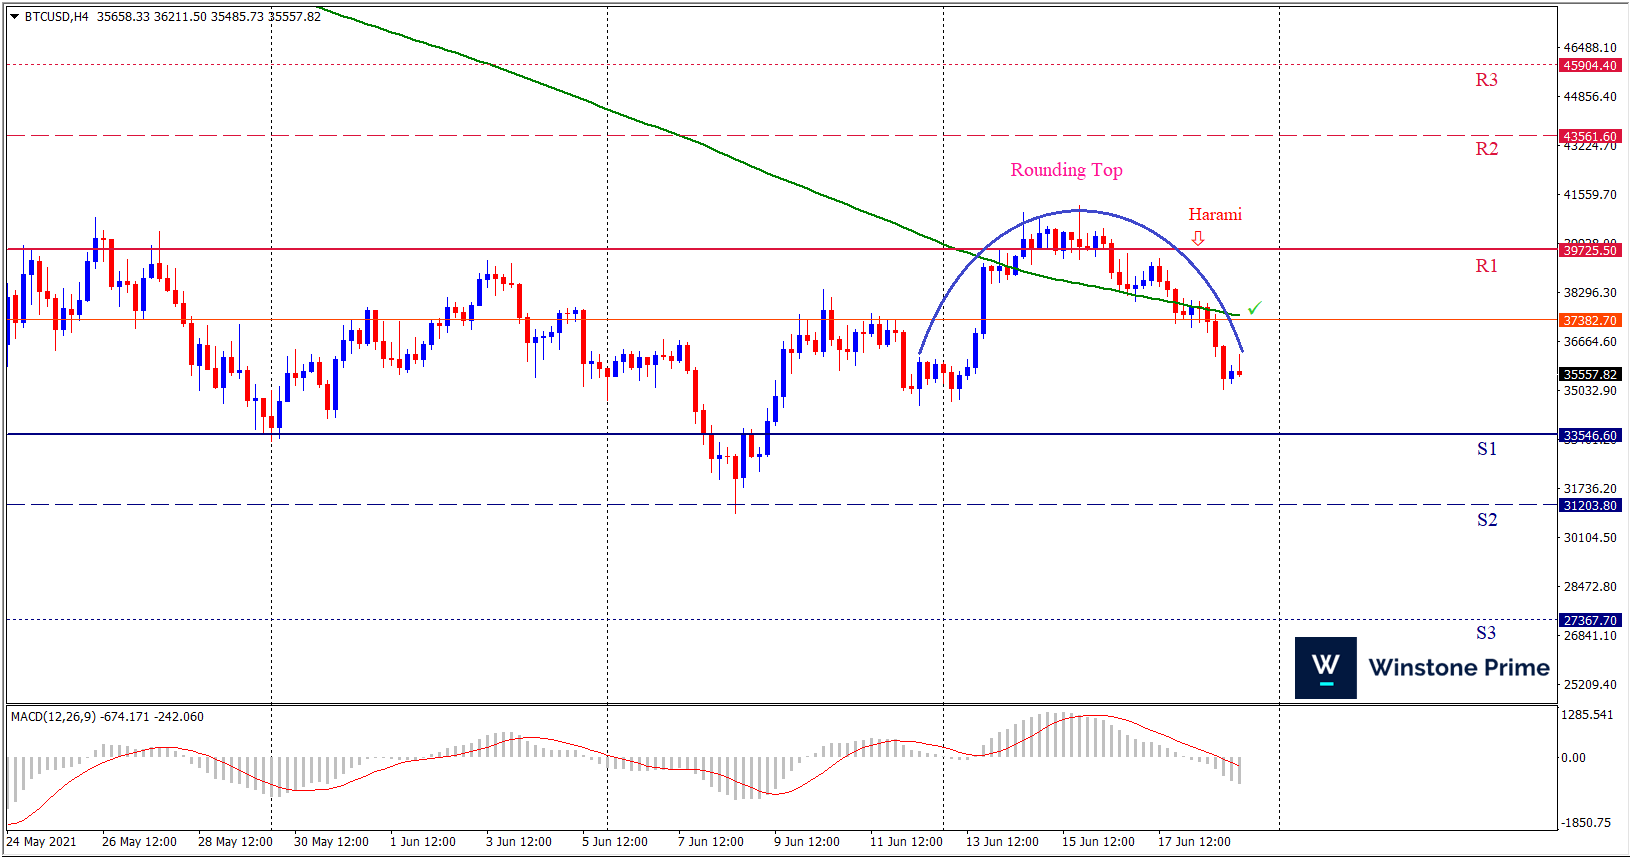
Last week’s high was 4.94% higher than the previous week. Maintaining high at 41218.7 and low at 35089.8 showed a movement of 6178 pips.

In the upcoming week we expect BTC/USD to show a bearish trend. The Instrument is trading below the 200 Simple Moving Average and the MACD trades to the downside. A solid breakout below 33546.6 may open a clean path towards 31203.8 and may take a way down to 27367.7. Should 39725.5 prove to be unreliable resistance, the BTCUSD may raise upwards 43561.6 and 45904.4 respectively. In H4 chart rounding top pattern favors prospects of a bearish trend. Bearish harami pattern constructs a bearish outlook for the pair in the upcoming week.

Preference
Sell: 35250.5 target at 31204.8 and stop loss at 37387.6


Alternate Scenario
Buy: 37387.6 target at 43560.3 and stop loss at 35250.5

XAU/USD Weekly Forecast (21st Jun 2021 – 25th Jun 2021)

Fundamental view:

Last week gold was crushed, with it having one of its worst weeks since Coronavirus hit last year. And it is worth recalling that the Fed took a sudden hawkish turn on Wednesday and brought forward its projections for the first post-pandemic interest rate hikes to 2023. The Fed also indicated that it will soon work on tapering down the current $120 billion in monthly bond purchases. This was seen as another factor pressuring on the non-yielding gold.              

The major economic events deciding the movement of the pair in the next week are FOMC Member Williams Speech at Jun 21, Fed Chair Powell Testimony at Jun 22, Markit Manufacturing PMI, EIA Crude Oil Stocks Change at Jun 23, GDP quarterly report, Core Durable Goods Orders, Initial Jobless Claims at Jun 24 and Core PCE Price Index at Jun 25 for US.

XAU/USD Weekly outlook:

Technical View:

Last week’s high was 1.37% lower than the previous week. Maintaining high at 1877.5 and low at 1760.8 showed a movement of 1167 pips.

In the upcoming week we expect XAU/USD to show a bearish trend.  The Instrument is trading below the 200 Simple Moving Average and the MACD trades to the downside. A solid breakout below 1724.4 may open a clean path towards 1684.2 and may take a way down to 1607.7. Should 1841.1 prove to be unreliable resistance, the XAUUSD may raise upwards 1917.6 and 1957.8 respectively. In H4 chart descending triangle pattern breakout favors prospects of a bearish trend. Also to be noted bearish harami formation exerts the expectation of downtrend for the pair.

Preference
Sell: 1765.7 target at 1685.2 and stop loss at 1845.4


Alternate Scenario
Buy: 1845.4 target at 1956.8 and stop loss at 1765.7

AUD/USD Weekly Forecast (21st Jun 2021 – 25th Jun 2021)

Fundamental view:

The Australian dollar has fallen rather hard during the course of the trading week. Chief Jerome Powell & Co. upwardly reviewed their forecasts on growth and inflation for this year and the next, bringing forward chances of rising rates, as the dot-plot now shows two possible hikes for 2023. Till now, the Fed has noted that they will react to actual data and not forecasts, but somehow, US policymakers contradicted themself with their latest decision, encouraged by progress in the immunization campaign. Chief Powell said that they are thinking on thinking of tapering but clarified that they would notify it in advance.

US Building Permits on 16th June and Australia Unemployment Rate on 17th June created uptrend for the pair whereas US Philadelphia Fed Employment & US Continuing Jobless Claims on 17th June and US Philadelphia Fed Employment & US Continuing Jobless Claims on 17th June created downtrend for the pair.

The major economic events deciding the movement of the pair in the next week are Australia Retail Sales monthly report at Jun 21, Fed Chair Powell Testimony at Jun 22, RBA Assistant Governor Ellis Speech, US Markit Manufacturing PMI at Jun 23, US GDP quarterly report, US Core Durable Goods Orders, US Initial Jobless Claims at Jun 24 and US Core PCE Price Index at Jun 25.

AUD/USD Weekly outlook:

Technical View:

Last week’s high was 0.64% lower than the previous week. Maintaining high at 0.7725 and low at 0.7478 showed a movement of 247 pips.

In the upcoming week we expect AUD/USD to show a bearish trend.  The currency pair is trading below the 200 Simple Moving Average and the MACD trades to the downside. A solid breakout below 0.7396 may open a clean path towards 0.7313 and may take a way down to 0.7149. Should 0.7643 prove to be unreliable resistance, the AUDUSD may raise upwards 0.7807 and 0.7890 respectively. In H4 chart bearish gartley pattern formation favors prospects of a bearish trend. Also to be noted bearish engulfing formation exerts the expectation of downtrend for the pair.

Preference
Sell: 0.7479 target at 0.7314 and stop loss at 0.7565


Alternate Scenario
Buy: 0.7565 target at 0.7806 and stop loss at 0.7479

USD/JPY Weekly Forecast (21st Jun 2021 – 25th Jun 2021)

Fundamental view:

The US dollar has rose drastically against the yen during the week after the Federal Reserve spook the markets by suggesting they may actually see inflation. As widely expected, the Federal Open Market Committee (FOMC), left the fed funds target range at 0.0% to 0.25%, where it has been since March 2020 and did not alter the $120 billion a month of credit asset purchases. Overall the dollar is trading high against yen.

Japan Industrial Production monthly report on 14th June and US Initial Jobless Claims & US Initial Jobless Claims 4-Week Average on 17th June favored bearish trend for the pair whereas Japan Adjusted Trade Balance on 16th June, US EIA Crude Oil Stocks Change on 16th June favored bullish trend for the pair.

The major economic events deciding the movement of the pair in the next week are BoJ Monetary Policy Meeting Minutes, Fed Chair Powell Testimony at Jun 22, Japan Markit Manufacturing PMI, US Markit Manufacturing PMI at Jun 23, BoJ Governor Kuroda Speech, US GDP quarterly report, US Core Durable Goods Orders, US Initial Jobless Claims at Jun 24 and US Core PCE Price Index at Jun 25.

USD/JPY Weekly outlook:

Technical View:

Last week’s high was 0.90% higher than the previous week. Maintaining high at 110.82 and low at 109.60 showed a movement of 122 pips.

In the upcoming week we expect USD/JPY to show a bullish trend. The currency pair is trading above the 200 Simple Moving Average and the MACD trades to the upside. A solid breakout above 110.82 may open a clean path towards 111.43 and may take a way up to 112.04. Should 109.60 prove to be unreliable support, the USDJPY may sink downwards 108.99 and 108.38 respectively. In H4 chart diamond pattern breakout favors prospects of a bullish trend Along with a bullish engulfing formation braces our expectation.

Preference
Buy: 110.24 target at 111.42 and stop loss at 109.55


Alternate Scenario
Sell: 109.55 target at 108.39 and stop loss at 110.24