Industrial production report favors yen

Japanese yen is trading high compared to greenback which is due to the favorable data released today. The Industrial output of Japan has extended its gains in April as the manufacturers seem to be benefited from a recovery in appetite for capital goods, specially in key overseas markets.

The Official data which was released on Monday showed that factory output has grown 2.5% from the previous month record of 1.9% in April and leaving behind the expectation of 1.7%, as higher production of general-purpose and electrical machinery offset a contraction in cars and transportation equipment output.

The Retail sales yearly report also shows a markup of 12.0% which is more than the previous record of 5.2% and expectation of 0.1% but the retail sales monthly report has shown a drop in the figure to -4.5% against last month record of 1.2% and expectation of -1.6%

Conusmer confidence in Japan has improved to 34.1 from previous record of 33.1. Elsewhere, The Housing starts also records a improved figure of 7.1% against the previous record of 4.9% and leaving behind the forecast of 1.5%

Japan published on Friday the Unemployment Rate, which rose to 2.8% in April, while Tokyo inflation printed at -0.4% YoY in the same month.

One more item favoring the yen is that SoftBank (a Japanese multinational conglomerate holding company) is said to be considering offloading its stake in Paytm (an Indian mobile payments and commerce platform) a circa $1.5bn flow, if it should occur and SoftBank indeed bring the funds back to Japan (a lot of ifs but there you go).

On the other hand, Prime Minister Yoshihide Suga officially extended the state of emergency to June 20. The coronavirus vaccination rollout for people under the age of 65 in Japan will be carried out at the same time as those with underlying conditions to help speed up the process, the health minister of Japan said Sunday.

The health ministry had already instructed municipalities to begin sending vaccination vouchers to all those eligible under 65 from the middle of June. But now, even those without underlying medical conditions will be able to get their dose upon receiving the voucher next month.

USD/JPY 4 Hour Chart:

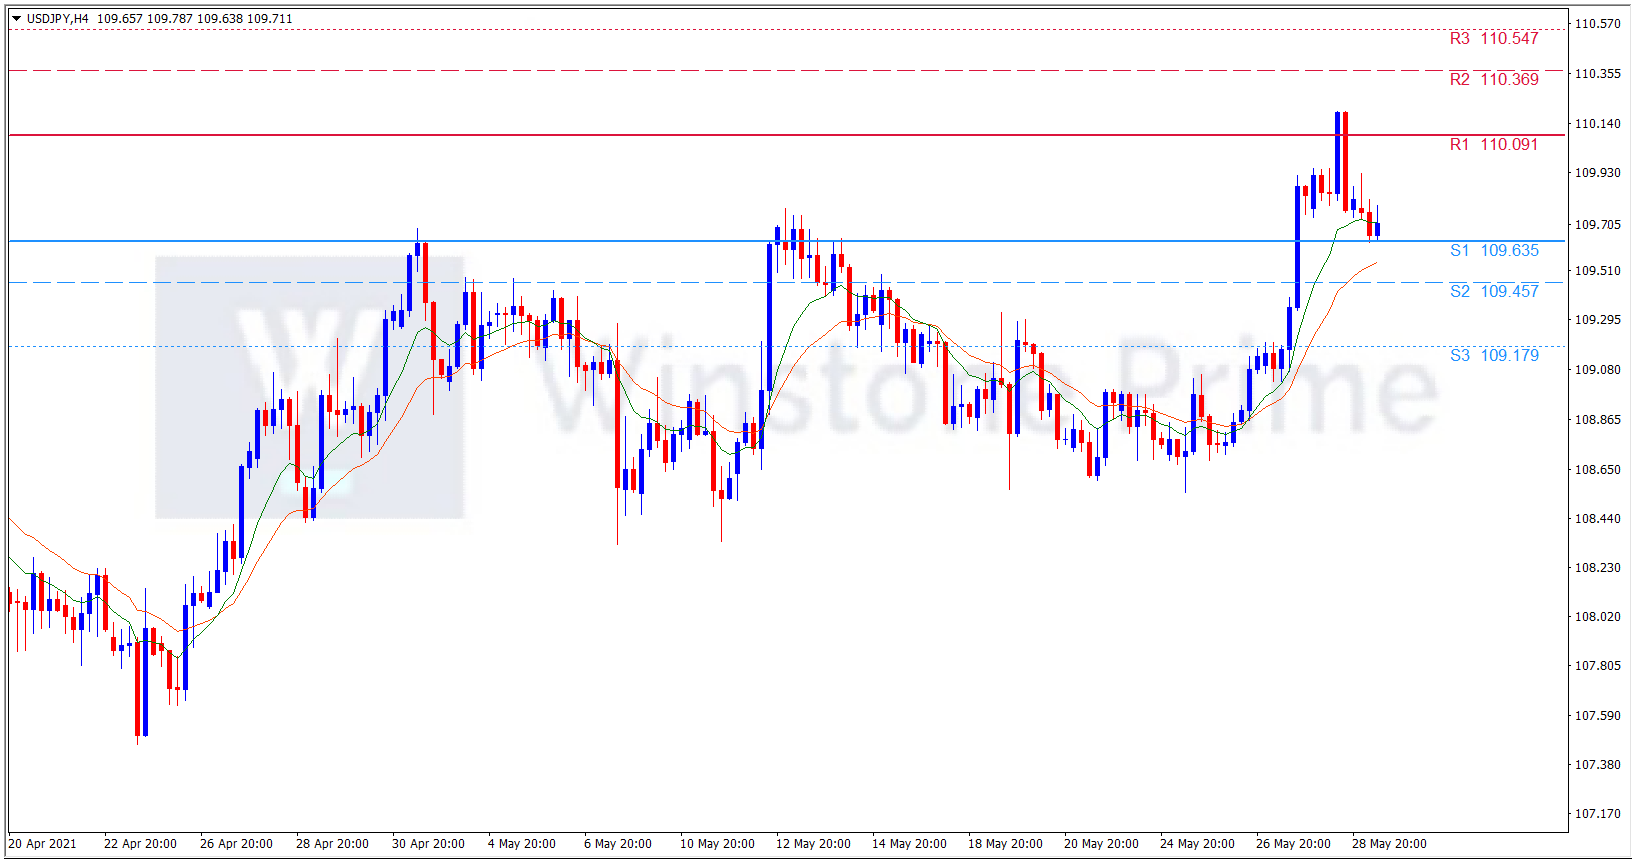
Support: 109.64 (S1), 109.46 (S2), 109.18 (S3).

Resistance: 110.09 (R1), 110.37 (R2), 110.55 (R3).

As US has no data to be released today, we expect the favorable data’s to support yen today. We expect a bearish trend for USD/JPY.

BTC/USD Weekly Forecast (31th May 2021 – 04th Jun 2021)

Fundamental view:

Bitcoin price seems to be recovering from the losses which was witnessed last week. While institutional investors’ ETF applications are helping bolster the adoption curve and hasten the process, several on-chain metrics combined with the developments surrounding regulating BTC mining in China and Iran has put a hault in the recovery.

On the other hand, Elon Musk once again spoke on the old debate about using fossil fuels for mining Bitcoin when he revealed that Tesla would no longer accept BTC as payment. His remarks sent shockwaves across the cryptocurrency market as Bitcoin price started a new descent. Elsewhere, China added fuel to the flame when reports of a mining ban spread like wildfire. While Iran is about to enforce an outright ban, Sichuan’s government officials plan to host a seminar next week to identify the impact of the Bitcoin mining ban on hydroelectricity excess. 

The major economic events deciding the movement of the pair in the next week are ISM Manufacturing PMI at Jun 01, Fed Beige Book Jun 02, ADP Nonfarm Employment Change, EIA Crude Oil Stocks Change Jun 03, Fed Chair Powell Speech and Nonfarm Payrolls at Jun 04 for US.

BTC/USD Weekly outlook:

Technical View:

Last week’s high was 14.10% lower than the previous week. Maintaining high at 40793.1 and low at 33498.6 showed a movement of 7295 pips.

In the upcoming week we expect BTC/USD to show a bearish trend. The Instrument is trading below the 200 Simple Moving Average and the MACD trades to the downside. A solid breakout below 33042.0 may open a clean path towards 29623.1 and may take a way down to 25747.5. Should 40336.5 prove to be unreliable resistance, the BTCUSD may raise upwards 44212.1 and 47631.0 respectively. In H4 chart rounding top pattern favors prospects of a bearish trend. Shooting star pattern constructs a bearish outlook for the pair in the upcoming week.

Preference
Sell: 36414.6 target at 29624.2 and stop loss at 40341.5


Alternate Scenario
Buy: 40341.5 target at 47630.7 and stop loss at 36414.6

XAU/USD Weekly Forecast (31th May 2021 – 04th Jun 2021)

Fundamental view:

Gold price is on its way to the highest levels seen this year after recovering more than $220 since the bottom at the end of March. During the last week, Federal Reserve Governor Lael Brainard repeated that the Fed has the tools to guide inflation back down if it were to move persistently above the Fed’s target. The US Bureau of Economic Analysis (BEA) announced on Thursday that it left the annualized Real Gross Domestic Product (GDP) growth for the first quarter unchanged at 6.4% in its second estimate. Other datas revealed that the weekly Initial Jobless Claims fell to the lowest level in more than a year at 406,000. 

Core Personal Consumption Expenditures (PCE) Price Index jumped to 3.1% on a yearly basis in April from 1.9% in March. The US Dollar Index climbed to its strongest level in more than ten days at 90.44. Despite of positive data for US, yellow metal traded high.

The major economic events deciding the movement of the pair in the next week are ISM Manufacturing PMI at Jun 01, Fed Beige Book Jun 02, ADP Nonfarm Employment Change, EIA Crude Oil Stocks Change Jun 03, Fed Chair Powell Speech and Nonfarm Payrolls at Jun 04 for US.

XAU/USD Weekly outlook:

Technical View:

Last week’s high was 1.20% higher than the previous week. Maintaining high at 1912.7 and low at 1872.7 showed a movement of 400 pips.

In the upcoming week we expect XAU/USD to show a bullish trend.  The Instrument is trading above the 200 Simple Moving Average and the MACD trades to the upside. A solid breakout above 1919.6 may open a clean path towards 1936.2 and may take a way up to 1959.6. Should 1879.6 prove to be unreliable support, the XAUUSD may sink downwards 1856.2 and 1839.6 respectively. In H4 chart bullish flag pattern favors prospects of a bullish trend. Also to be noted hammer formation exerts the expectation of uptrend for the pair.

Preference
Buy: 1903.9 target at 1935.8 and stop loss at 1874.6


Alternate Scenario
Sell: 1874.6 target at 1840.5 and stop loss at 1903.9

AUD/USD Weekly Forecast (31th May 2021 – 04th Jun 2021)

Fundamental view:

The Australian dollar initially rallied during the course of the trading week but gives back the gains and reached the 0.76 level. Weakness in the Aussie may have been for a couple of reasons. The first reason is the drop in iron ore prices, with the Dalian Commodity Exchange (DCE) futures contract down over 17% from the May 12th peak. The second reason could be due to a decline in Australian 10-year government bond yields, signaling that the markets may be pricing in a slightly more dovish RBA. This may be due to another temporary lockdown in Melbourne.

Australia Construction Work Done quarterly report on 26th May and Australia Private New Capital Expenditure on 27th May favored uptrend whereas US S&P/CS HPI Composite-20 yearly report on 25th May and US EIA Crude Oil Stocks Change & US EIA Cushing Crude Oil Stocks Change on 26th May favored downtrend for the pair.

The major economic events deciding the movement of the pair in the next week are OPEC Meeting, RBA Interest Rate Decision, US ISM Manufacturing PMI at Jun 01, Australia GDP quarterly report, US ADP Nonfarm Employment Change, Australia retail sales monthly report, US EIA Crude Oil Stocks Change Jun 03, Fed Chair Powell Speech and US Nonfarm Payrolls at Jun 04.

AUD/USD Weekly outlook:

Technical View:

Last week’s high was 0.22% lower than the previous week. Maintaining high at 0.7795 and low at 0.7676 showed a movement of 119 pips.

In the upcoming week we expect AUD/USD to show a bearish trend.  The currency pair is trading below the 200 Simple Moving Average and the MACD trades to the downside. A solid breakout below 0.7657 may open a clean path towards 0.7607 and may take a way down to 0.7538. Should 0.7776 prove to be unreliable resistance, the AUDUSD may raise upwards 0.7845 and 0.7895 respectively. In H4 chart Symmetrical triangle breakout favors prospects of a bearish trend. Also to be noted bearish engulfing formation exerts the expectation of downtrend for the pair.

Preference
Sell: 0.7709 target at 0.7608 and stop loss at 0.7784


Alternate Scenario
Buy: 0.7784 target at 0.7864 and stop loss at 0.7709