Rising inflation favors yellow metal

Gold Prices are somewhat up early Friday due to concerns on increasing inflation.

Thursday’s U.S. producer price index report for April came in at up 0.6% from the month of March, which is double of the forecast 0.3%. The April CPI was up over 6%, year-on-year. The PPI report followed a hot consumer price index report issued on Wednesday. These are the evidences that shows that the U.S. economy and even other major global economies will have to battle unwanted inflationary pressures at some point down the road.

This Higher inflation would typically create bullish market sentiment for the precious yellow metal. Wednesday’s report by the Bureau of Labor Statistics indicated that inflation rose by 0.8% in April, which takes the annual inflation rate to 4.2%, that is the highest level of inflation seen since 2008.

The primary reason behind the inflation is due to the massive increase in the cost of new and used cars and trucks.

As per the data,  cost of a new or used automobile or truck increased by approximately 10%. The main cause for such a dramatic increase in a short period of time was a supply issue based upon a shortage of microchips needed in automobile production.

This supply-chain issue will most likely be temporary in nature and hence it was viewed in a much different way. And  the other component was increase costs in food. That being said, there is also a supply-chain issue, but food costs could continue to maintain a higher price point for a longer period of time and have a sustained and systemic impact on the inflation rate.

Economists believe that the concern regarding rising inflation is legitimate and a reason for real concern.

XAU/USD 4 Hour Chart:

Support: 1813.2 (S1), 1801.0 (S2), 1793.2 (S3).

Resistance: 1833.3 (R1), 1841.0 (R2), 1853.3 (R3).

Increasing inflation raises concerns among the traders which is favorable for the yellow metal and we expect a bullish trend for XAU/USD.

US Consumer prices favors greenback

The New Zealand dollar sank against the greenback because of the expectations on earlier-than-expected policy tightening by the Federal Reserve as a response to rapid inflation and higher treasury yields.

As per the data released on Wednesday, U.S. consumer prices increased by the most in nearly 12 years in April as booming demand amid a reopening economy pushed against supply constraints.

Analysts hope that the greenback is likely to continue to strengthen as some investors unwind bearish bets, and re-position in anticipation of sustained inflation as more economies emerge from the coronavirus pandemic.

On the other hand, New Zealand Prime Minister Jacinda Ardern said on Thursday that her government will explore more travel “bubbles” and lead trade delegations later this year to re-connect with a post-pandemic world after more than a year of border closures.

Tough lockdowns and its geographical location has helped New Zealand eliminate the novel coronavirus within its borders, but left the country of 5 million isolated from the rest of the world.

An organisation attacking public faith in New Zealand’s Covid-19 strategy claims it has raised $50,000 towards printing two million virus “fact” flyers to be dropped nationwide – and is considering printing more. The flyers, which Voices For Freedom intends to deliver to every letterbox in the country, outlines multiple conspiracy theories about Covid-19 vaccines and their effects. Their contents have been described as “misleading” and in some cases “palpably false”.

NZD/USD 4 Hour Chart:

Support: 0.7116 (S1), 0.7072 (S2), 0.6993 (S3).

Resistance: 0.7240 (R1), 0.7319 (R2), 0.7363 (R3).

Traders will keep an eye on U.S. weekly jobless claims due later on Today and retail sales numbers on Friday for guidance on whether upward pressure on prices will persist. In the meantime greenback is trading upside with improved market sentiment among traders we expect a bearish trend for NZD/USD.

How the Elliott Wave Principle Can Boost Your trading

The Elliott Wave - 1

Many Thousands of today’s forex traders consider the Elliott Wave Principle a vital part of their trading arsenal. Why? Because the Wave Principle’s rules and guidelines provide the context that helps traders identify the trend on any time frame, highs and lows in prices, find high-confidence trade targets and spot all-important points of ruin that tell you when you’re wrong.

The Elliott Wave Principle posits that collective investor psychology, or crowd psychology, moves between optimism and pessimism in natural sequences. These mood swings create patterns evidenced in the price movements of markets at every degree of trend or time scale.

In this article we will show you how you can put the power of wave analysis to work in your forex trading.

What is the Elliott Wave Theory?

Elliott Wave Theory basics are surprisingly straight forward. In the early 1920’s, a man named Ralph Nelson Elliott discovered that currency markets actually traded in repetitive cycles, rather than in an unpredictable manner. Elliott wave predictions proved that these market cycles are directly correlated to the predominant psychology of the masses at the time, and investors’ reactions to such outside factors.

Following this, Elliot soon found that the rise and fall of the mass psychology was always showing up in the same repetitive patterns; he called these consistencies ‘waves’. Based somewhat on the Dow Theory, which states that the prices of stocks move in waves, Elliott was able to analyse and interpret the market to a much higher degree, due to their fractal nature.

How Elliott Waves Work?

Some technical analysts try to profit from wave patterns in the market using the Elliott Wave Theory. This hypothesis says that currency price movements can be predicted because they move in repeating up-and-down patterns called waves that are created by investor psychology or sentiment.

The theory identifies several different types of waves, including motive waves, impulse waves, and corrective waves. It is subjective, meaning not all traders interpret the theory the same way or agree that it is a successful trading strategy.

Unlike most other price formations, the whole idea of wave analysis itself does not equate to a regular blueprint formation where you simply follow the instructions. Wave analysis offers insights into trend dynamics and helps you understand price movements in a much deeper way.

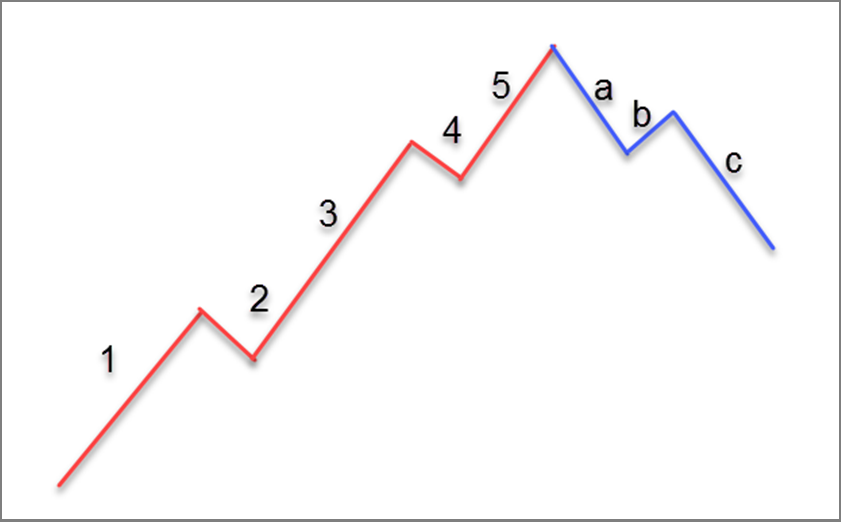
Picture – The Elliott Wave principle consists of impulse and corrective waves at its core.

The patterns link to form five and three-wave structures which themselves underlie self-similar wave structures of increasing size or higher degree. Note the lowermost of the three idealized cycles. In the first small five-wave sequence, waves 1, 3 and 5 are motive, while waves 2 and 4 are corrective. This signals that the movement of the wave one degree higher is upward. It also signals the start of the first small three-wave corrective sequence. After the initial five waves up and three waves down, the sequence begins again and the self-similar fractal geometry begins to unfold according to the five and three-wave structure which it underlies one degree higher. The completed motive pattern includes 89 waves, followed by a completed corrective pattern of 55 waves.

Trend and Consolidation Price Structures

Elliott found that, when a trend is underway, it typically has three large price moves in the direction of the trend, interspersed with two corrections. This creates a five-wave pattern: impulse, correction, impulse, correction, and another impulse. Traders often refer to these five waves by the number in which they occur. Therefore, if you hear a trader refer to “wave four” of a currency, they’re talking about the second correction (the one that comes after the second impulse).

A similar count of three movements can be measured within each correction. There will be a sharp move against the trend (the impulse of the correction), followed by a small movement back in the direction of the trend (the correction of the correction), and finally, there’s one last sharp movement against the trend (a second impulse of the correction) before the correction is over and the trend resumes. To prevent confusion with the numbered waves of the overall trend, corrective waves are labeled A, B, and C.

Remember, these movements are fractal, so the patterns occur on small and large time frames. For example, the first impulse wave higher within an uptrend on a daily chart may be composed of five waves on an hourly chart. Each corrective wave (waves two and four) is composed of three smaller waves (A, B, C), and there will also be larger A, B, C waves on a longer time frame as the broader trend ends (after wave five).

Typical Correction Size

When buying on corrections during an uptrend or selling on corrections in a downtrend, it is helpful to know how large the typical correction is. Unfortunately, there isn’t a set calculation, but there are some guidelines that can help you learn where to look for an impulse or correction to end.

In general, wave three is the largest wave of the cycle. Waves two and four cannot be larger than waves one, three, or five (or else it isn’t an Elliott wave cycle).

As he was developing his wave theory, Elliott made extensive use of the Fibonacci ratios. Traders may be familiar with these ratios from the Fibonacci retracement tool, which your brokerage will likely offer with its charting software. This means, when you’re measuring Elliott waves, you should keep an eye out for key Fibonacci percentages, such as 38%, 50%, and 62%.

For example, if you’re watching a correction after an impulse, you might use the Fibonacci retracement tool to draw lines on your chart at 38%, 50%, and 62%. As the price action approaches those lines, look for signs of weakness—that could be a sign that the correction is ending.

Conclusion

You can utilize the three concepts discussed here—How Elliott waves works and trend structures, and correction sizes—by only taking trades in the direction of the impulse waves. Take trades during the corrective waves and look for trade entry signals once the price has corrected the average amount. The correction isn’t likely to stop exactly at the percentage levels discussed above, so it’s better to use those as reference points and wait for the chart to confirm your suspicions before jumping into a trade.

Another important aspect to highlight is that out of so many trading indicators available, the EW oscillator is widely used. This is because it has given rise to a special type of analysis – EW analysis. While many traders base their analysis on this oscillator, there are some traders completely against using it.

As a theory, Elliott’s waves are both strongly accepted, and strongly criticised in the trading community. We hope that this article has been useful for you and we hope you understand how Elliott Wave Theory can boost your trading and it will help you to reach the target.

Expectation on UK GDP numbers impacts pound

Pound shows a mixed trend against the greenback ahead of the preliminary reading of the first-quarter (Q1) 2021 UK GDP numbers, up for publishing at 06:00 GMT. Forecasts suggest that the UK GDP will rise to 1.4% MoM in March versus 0.4% previous readouts while the Index of Services (3M/3M) for the same period is seen recovered from -1.9% prior.

Manufacturing Production that makes up around 80% of total industrial production is expected to decrease from 1.3% MoM prior to 1.0% in March. Further, the total Industrial Production is expected to remain unchanged at 1.0% during the stated month. Looking at the yearly figures, the Industrial Production for March may have recovered from -3.5% to +2.3% while the Manufacturing Production is also anticipated to have risen by 3.7% in the reported month versus 4.2% contraction marked the last.

Elsewhere, Prime Minister Boris Johnson promised on Tuesday to “level up” Britain by tackling inequality and driving an economic recovery from the pandemic with a raft of laws presented to parliament by Queen Elizabeth.

Queen Elizabeth while addressing members of the upper chamber of parliament from the throne in the House of Lords said that “My government’s priority is to deliver a national recovery from the pandemic that makes the United Kingdom stronger, healthier and more prosperous that before.”

On the other hand, London and Brussels agreed to keep Northern Ireland within the EU’s trading sphere and avoiding a hard border on the island of Ireland but introducing trade barriers, including a customs border, between the province and the rest of the United Kingdom.

“Businesses have gone to extraordinary efforts to make the current requirements work, but it is hard to see that the way the Protocol is currently operating can be sustainable for long,” British negotiator and junior minister David Frost said in a statement.

GBP/USD 4 Hour Chart:

Support: 1.4108 (S1), 1.4075 (S2), 1.4046 (S3).

Resistance: 1.4171 (R1), 1.4200 (R2), 1.4233 (R3).

The post-Brexit N.Ireland trade rules issues and the expectation on UK GDP report along with the Broad Us dollar weakness frames a mixed trend for sterling against the greenback.