USD/JPY Weekly Forecast (10th May 2021 – 14th May 2021)

Fundamental view:

The USD/JPY showed a bearish trend in the previous week. The dollar has eased amid cooling expectations for higher rates in the US, which sent stocks up and US Treasury yields lower. The Bank of Japan published the Minutes of its latest meeting, which brought no surprises. The central bank will maintain its quantitative easing, despite some members expressing concerns about its effects on the financial system in the long run. Also, local news agencies reported that Tokyo’s state of emergency due to corona virus will be extended until the end of May.

US Factory Orders monthly report on 4th May and US Initial Jobless Claims 4-Week Average on 6th May framed bullish trend whereas US ISM Manufacturing PMI on 3rd May and US EIA Cushing Crude Oil Stocks Change on 5th May framed bearish trend for the pair.

The major economic events deciding the movement of the pair in the next week are BoJ Summary of Opinions, US JOLTS Job Openings at May 11, Japan Adjusted Current Account, US Core CPI monthly report, US EIA Crude Oil Stocks Change at May 12, US Initial Jobless Claims at May 13, US Retail Sales monthly report and Fed Industrial Production yearly report at May 14.

USD/JPY Weekly outlook:

Technical View:

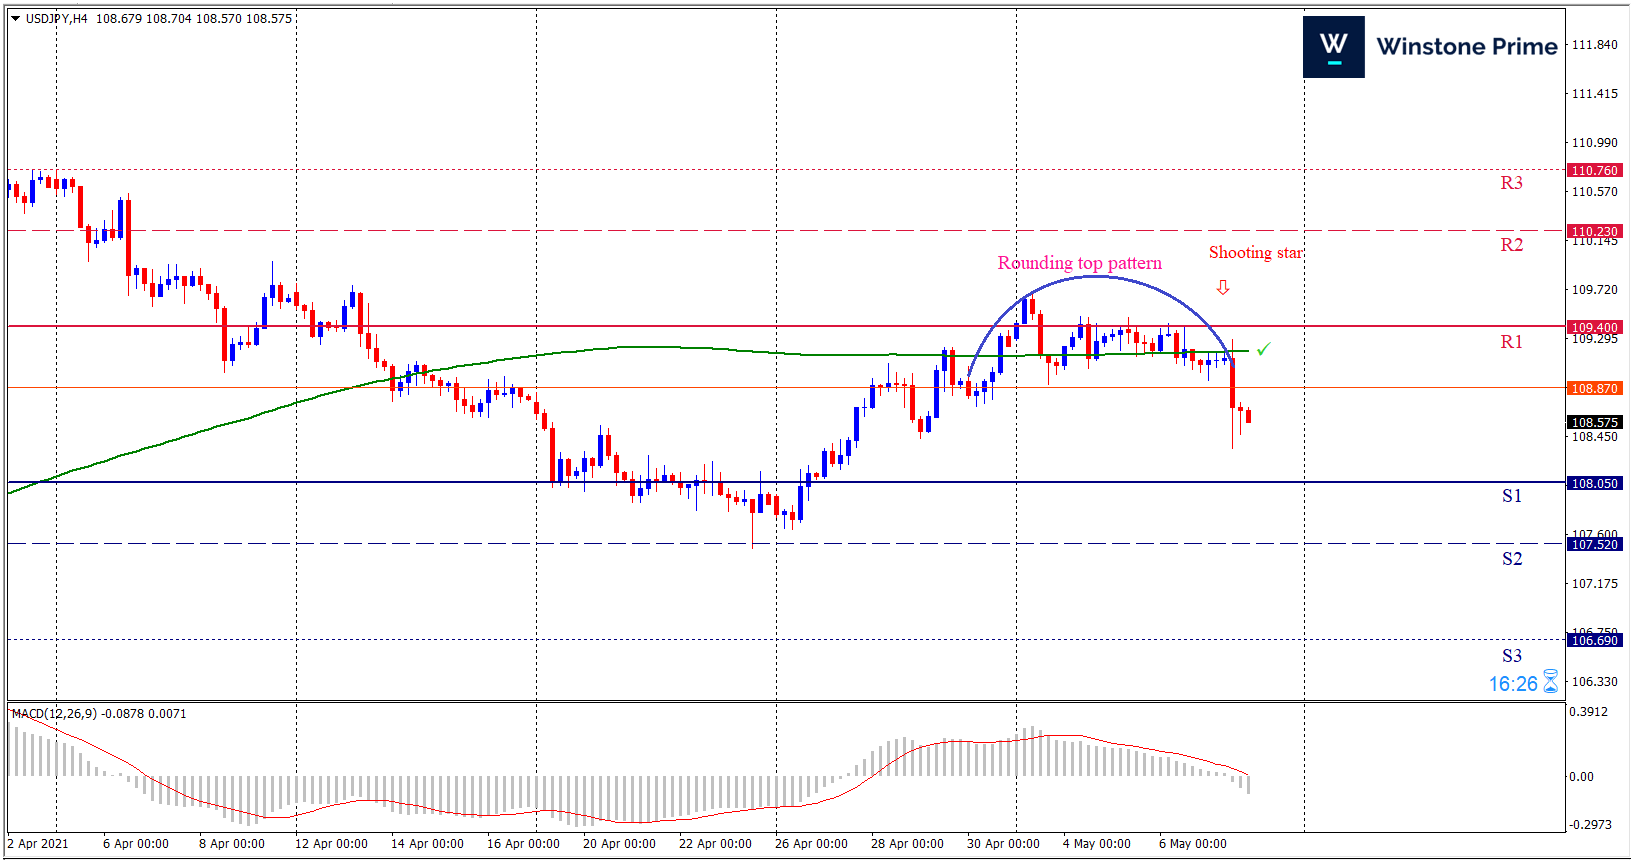
Last week’s high was 0.30% higher than the previous week. Maintaining high at 109.70 and low at 108.34 showed a movement of 136 pips.

In the upcoming week we expect USD/JPY to show a bearish trend. The currency pair is trading below the 200 Simple Moving Average and the MACD trades to the downside. A solid breakout below 108.05 may open a clean path towards 107.52 and may take a way down to 106.69. Should 109.40 prove to be unreliable resistance, the USDJPY may raise upwards 110.23 and 110.76 respectively.  In H4 chart, Formation of rounding top pattern indicates reversal of the trend creating prospects of a bearish trend Along with a shooting star formation braces our expectation.

Preference
Sell: 108.57 target at 107.53 and stop loss at 109.45


Alternate Scenario
Buy: 109.45 target at 110.75 and stop loss at 108.57

BTC/USD Weekly Forecast (10th May 2021 – 14th May 2021)

Fundamental view:

Bitcoin showed a mixed trend in the last week. The most significant development surrounding Bitcoin over the past week was the introduction of Bitcoin, Ether and Cryptocurrency MegaCap indexes by S&P Dow Jones Indices. Bitcoin and Ethereum may be the first cryptocurrencies to get their indexes listed in the traditional form, the firm’s global head of innovation, Peter Roffman, mentioned that other digital assets meeting their criteria would follow.

Despite the growing interest for Bitcoin among institutional investors, its price has remained stagnant. The inability of buyers to push it further up has caused the bears to take partial control. Overall bitcoin has showed a small bull this week.

The major economic events deciding the movement of the pair in the next week are JOLTS Job Openings at May 11, Core CPI monthly report, EIA Crude Oil Stocks Change at May 12, Initial Jobless Claims at May 13, Retail Sales monthly report and Fed Industrial Production yearly report at May 14 for US.

BTC/USD Weekly outlook:

Technical View:

Last week’s high was 0.83% higher than the previous week. Maintaining high at 58907.3 and low at 52801.0 showed a movement of 6106 pips.

In the upcoming week we expect BTC/USD to show a bullish trend. The Instrument is trading above the 200 Simple Moving Average and the MACD trades to the upside. A solid breakout above 60033.9 may open a clean path towards 62523.7 and may take a way up to 66140.2. Should 53927.6 prove to be unreliable support, the BTCUSD may sink downwards 50311.1 and 47821.3 respectively. In H4 chart bullish shark pattern formation favors prospects of a bullish trend. Bullish harami pattern constructs a bullish outlook for the pair in the upcoming week.

Preference
Buy: 57859.5 target at 63402.7 and stop loss at 53922.6


Alternate Scenario
Sell: 53922.6 target at 47822.3 and stop loss at 57859.5

EUR/USD Weekly Forecast (10th May 2021 – 14th May 2021)

Fundamental view:

EUR/USD trades around 1.2171 in the end of the week which has recovered all of the previous week´s losses and reached its monthly high at 1.2171. This is all because of the disappointing US employment report which has fueled the dollar’s sell-off at the end of the week, as the numbers confirmed the US Federal Reserve stance of keeping rates lower for longer. The American economic is showing signs of recovery in the last few days. It is clear that the country is recovering at a faster pace than its major counterparts. On the other hand, the EU economy is also turning the corner from the coronavirus crisis. Officials have begun analyzing easing travel restrictions on the bloc as the immunization campaign has gathered speed.

US Factory Orders monthly report on 4th May and Europe Government Budget Balance on 5th May favored bearish trend for the pair whereas Europe Retail Sales on 3rd May and Europe Factory Orders monthly report on 6th May created bullish trend for the pair.

The major economic events deciding the movement of the pair in the next week are Europe ZEW Economic Sentiment Indicator, US JOLTS Job Openings at May 11, US Core CPI monthly report, US EIA Crude Oil Stocks Change at May 12, US Initial Jobless Claims at May 13, ECB Monetary Policy Meeting Accounts, US Retail Sales monthly report and Fed Industrial Production yearly report at May 14.

EUR/USD Weekly outlook:

Technical View:

Last week’s high was 0.17% higher than the previous week. Maintaining high at 1.2171 and low at 1.1986 showed a movement of 185 pips.

In the upcoming week we expect EUR/USD to show a bullish trend. The currency pair is trading above the 200 Simple Moving Average and the MACD trades to the upside. A solid breakout above 1.2227 may open a clean path towards 1.2291 and may take a way up to 1.2412. Should 1.2042 prove to be unreliable support, the EURUSD may sink downwards 1.1921 and 1.1857 respectively. Chart formation of a rounding bottom pattern in H4 chart sets prospects for a bullish trend. Bullish engulfing formation in H4 chart escalates the expectation for a bullish trend.

Preference
Buy: 1.2152 target at 1.2290 and stop loss at 1.2038


Alternate Scenario
Sell: 1.2038 target at 1.1858 and stop loss at 1.2152

AUD/USD Weekly Forecast (10th May 2021 – 14th May 2021)

Fundamental view:

In the previous week, Aussie traded high against the greenback. The US Federal Reserve members spent quite a lot of time in clarifying that they would not change the current monetary policy regardless of higher inflation. US Treasury yields fell with such comments, accelerating their slump on Friday, as inflation and rate hikes have fallen off investors’ radar. In the Meantime, The Reserve Bank of Australia had a monetary policy meeting, leaving its current policy unchanged as widely anticipated.  Policymakers repeated that rates would remain at current levels at least until 2024, announcing a review of its current stance for next July.

Australia Trade Balance and US Factory Orders monthly report on 4th May favored downtrend for the pair whereas Australia Commonwealth Bank Manufacturing PMI & RBA Index of Commodity Prices yearly report on 3rd May and Australia Commonwealth Bank Services on 5th May favored uptrend for the pair.

The major economic events deciding the movement of the pair in the next week are Australia Retail Sales monthly report, NAB Business Confidence at May 10, US JOLTS Job Openings at May 11, US Core CPI monthly report, US EIA Crude Oil Stocks Change at May 12, US Initial Jobless Claims at May 13, US Retail Sales monthly report and Fed Industrial Production yearly report at May 14.

AUD/USD Weekly outlook:

Technical View:

Last week’s high was 0.58% higher than the previous week. Maintaining high at 0.7863 and low at 0.7675 showed a movement of 188 pips.

In the upcoming week we expect AUD/USD to show a bullish trend.  The currency pair is trading above the 200 Simple Moving Average and the MACD trades to the upside. A solid breakout above 0.7912 may open a clean path towards 0.7982 and may take a way up to 0.8100. Should 0.7724 prove to be unreliable support, the AUDUSD may sink downwards 0.7606 and 0.7536 respectively. In H4 chart double bottom breakout favors prospects of a bullish trend. Also to be noted Bullish engulfing formation exerts the expectation of uptrend for the pair.

Preference
Buy: 0.7841 target at 0.7981 and stop loss at 0.7719


Alternate Scenario
Sell: 0.7719 target at 0.7537 and stop loss at 0.7841