Understanding Currency Strength meter

What is a currency strength meter?

Currency strength meter is a technical indicator in forex trading. CSM shows an at-a-glance view of what is going on in the forex market.

Any trader needs to know the direction of the currency pair. It is also important to remember that the market movement is defined by the strength and weakness of the currencies that make up the pair. But how do we define the strength of a currency? There are different ways, one of which is fundamental analysis. However, it’s not 100% accurate. What provides a clearer view of the currency is the currency strength meter.

The currency strength meter is a general name of the indicator that shows whether you’re dealing with a strong or weak currency. This algorithm-based indicator relies on the exchange rates of various currency pairs to provide a degree of each currency’s strength. 

The currency strength meter analyzes each currency separately, not the currency pairs.

The currency strength meter refers to various indicators that measure the strength or weakness of the currency. 

As there is more than one version of the meter, you should know the differences. The more advanced variants implement their own weightings and may include other indicators that measure the currency’s strength. It helps to provide trading alerts. Simpler versions, on the other hand, don’t use any weighting. 

How does the currency strength meter work?

Now let’s look at how this technical indicator works

 It mostly consists of 4 steps. 

1. The indicator defines the base currency. 

2. Then it pairs the currency with all other currencies that are available for such action. 

3. After that, the indicator measures strength regarding each paired currency. 

4. In the end, the average score is calculated.

The main idea in how to use Forex strength meter is to view it as a “filter”. This indicator help us in understanding what made a pair move. For example, let’s say that EUR/USD is changing. The CSM will help us understand if it is the USD that is becoming strong, of if it’s the EUR that is becoming weak. This is very important to know at all times.

How to measure the strength

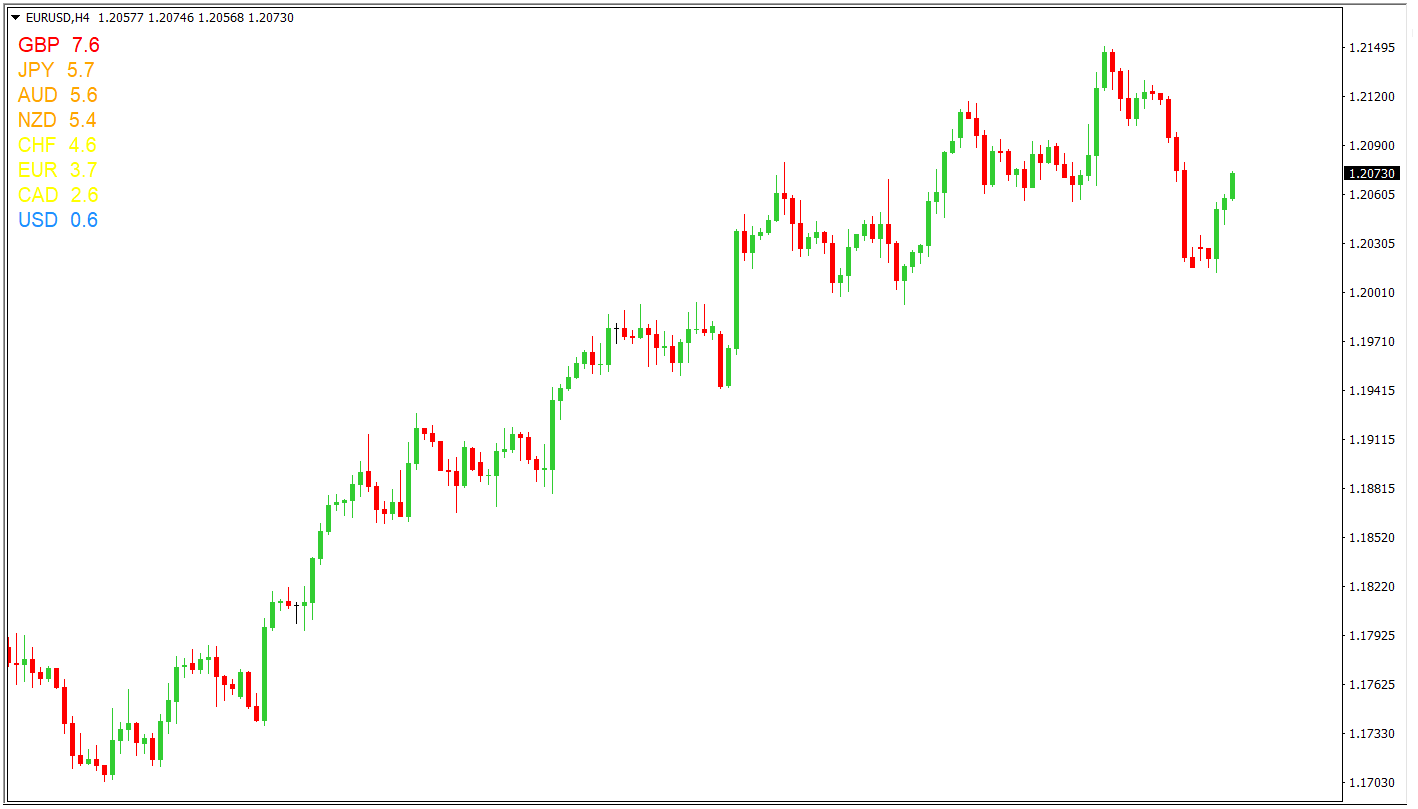
Many of the CSM indicators come with their own measuring system. In most cases, it will be a 0-10 strength measurement. The closer the rating is to 10, the stronger the currency is. Remember that this number can go below 1 as well.

Currency Strength Indicator in Action

After understanding how CSM works, now let’s look at using CSM in real trading. Usually, the indicator is used to either confirm a trend or its reversal. By applying it to the chart, you can define a weak and a strong currency. Thus, you’ll know which currency pair to buy and which one to sell. 

However, you should keep in mind that the currency won’t be equally strong or weak relative to other currencies in pairs. 

The main idea is to buy a strong currency against the weak one or sell the weak one against the strong one.

Option 1 :Find the Strongest and the Weakest

It’s the easiest and safest approach. All you need to do is define the strongest currency and the weakest one and trade their pair. 

For example, if the USD is the strongest and AUD is the weakest, you should sell the AUD/USD pair. So, you will simply trade in the trend’s direction. The same approach can apply to the trend reversal if you see the currency reached extreme readings of strength or weakness. 

Option 2: Average Readings

Of course, it doesn’t mean you can trade if only there are extremes of the currency readings. However, this approach is riskier because the currency’s strength doesn’t have a determined limit as gold does, for instance. Thus, it means the currency can continue getting stronger or weaker, and you will simply stay in a bad trade.

Mistakes to avoid when using CSM :

The first mistake that usually all the beginners make when using CSM is that they only use CSM. To make sure that CSM bring you your desired outcome, it is vital that you pair your trading with Forex strength meter with other indicators and chart analysis.

The CSM is just the foundation of your analysis, it simply helps you filter through the currencies which are worth analyzing at a current time. Once you do know the preferred currencies, it’s up to the chart to determine if it’s worth trading them.

The next mistake is failure to calculate the strength of a currency in contrast to major currency pairs. You see, in order for USD to be strong, it needs to be strong against the EUR, GBP, CHF, JPY, and other major currencies. It is already obvious that the USD is strong against other currencies that are not traded as much.

The third and final mistake is using only in short time frames. In order to use the Currency strength meter for trading, it’s preferable to use it with longer timeframes. This includes a couple of weeks or months timeframes. Only then will the strength of the currency be accurate. Remember, there is always some kind of news that could sow panic in the market, thus causing a major, but temporary disruption. This can seriously damage a currency’s strength in a shorter frame, but longer frames help balance that issue much more easily.

There are some tips that will allow you to use any version of the currency strength indicator.

  • Avoid trading negatively correlated currencies in the same direction. This rule applies to the correlation strategies when you shouldn’t open trade in the same direction, knowing the pairs mostly move in opposite directions. The currency strength indicator is a part of this rule. Even though if you see that currencies included in the pairs are both strong, but the pairs usually move in opposite directions, don’t open the same trades.
  • Diversify. The currency strength indicator can help you diversify your portfolio. You can open a trade with a currency that is losing its strength and open an opposite trade with a currency gaining momentum. This strategy doesn’t give any guarantees against losses. Still, it can limit them.

Final words :

The currency strength meter is an interesting tool that can provide additional signals and valuable information on the market direction. Understanding currency strength will be key for developing a long-term forex trading strategy. The strength of a currency is a clear indicator of whether corresponding currency pairs are about to experience a change in value. The currency strength index, the currency strength meter, and other currency strength indicators will directly affect your ability to determine whether a relative value change is likely to occur.

The currency strength indicator can be very appealing especially for beginner traders who are still in the process of learning how to trade.

So, to find your perfect tool, we recommend using a demo account. Winstone Prime demo account can help you practice your strategies using the currency strength meter. The fact that this indicator is customized makes it possible to implement on any trading platform.

Thank you for reading!

Upbeat in unemployment report favors Kiwi

The favorable unemployment report seems to support the New Zealand dollar against the greenback. The jobless rate of New Zealand in the three months ended March fell to 4.7 percent from 4.9 percent in the previous quarter, and compared with forecasts of 5.6 percent. The participation rate increased to 70.4 % from previous record of 70% and from forecast of 72%. The number of unemployed people fell by 5000 as the economy gained 15,000 jobs during the quarter, the majority of which were taken by women.

Economists hope that numbers showed the labour market was stronger than expected and there were signs wage growth would pick up over the year.

“Nonetheless, the labour market still has some way to go, with the rate of unemployment still above pre-pandemic levels and the underutilisation rate also elevated,” ASB senior economist Jane Turner said.

On the other hand, As per the latest news, US Treasury Secretary Janet Yellen said interest rates may have to rise to prevent the US economy overheating as President Joe Biden ramps up public spending. But the Economists who follow the Fed said it wasn’t clear whether Ms Yellen was referring to short-term interest rates, which the central bank controls, or longer-term rates determined by economic conditions.

Elsewhere, US President Joe Biden on Tuesday made a announcement of a goal to vaccinate 70per cent of US adults with at least one Covid-19 shot by the July 4 Independence Day holiday and said the government would innoculate 12- to 15-year-olds as soon as allowed.

He had previously announced July 4 as a target date for Americans to gather in small groups to celebrate the holiday and signal a return to greater normalcy in the middle of the pandemic. Biden’s new goal takes into account an increasing, though not unexpected, challenge of getting shots into the arms of people who are hesitant about the vaccine. The comments from the US president creates hopes among the investors.

 NZD/USD 4 Hour Chart:

Support: 0.7108 (S1), 0.7068 (S2), 0.7020 (S3).

Resistance: 0.7196 (R1), 0.7244 (R2), 0.7284 (R3).

Investors will now keep a watch on the ADP Nonfarm Employment Change and ISM Non-Manufacturing PMI of US which will released later today to direct their trades. In the meantime the Upbeat employment data supports kiwi against the greenback. And we expect a bullish trend for NZD/USD.

Britain seek to agree decisive action from G7

British government on Tuesday seek to agree decisive action from G7 partners to protect democracies against global threats like those posed by China and Russia. In the second day of Hosting in the foreign ministers’ meeting in London designed to lay the groundwork for a leaders’ summit in June, Raab will lead talks among the Group of Seven wealthy nations on threats to democracy, freedoms and human rights.

“The UK’s presidency of the G7 is an opportunity to bring together open, democratic societies and demonstrate unity at a time when it is much needed to tackle shared challenges and rising threats,” Raab said in a statement.

In addition to the G7 members Canada, France, Germany, Italy, Japan and the United States, Britain has also invited ministers from Australia, India, South Africa and South Korea this week. Their first face-to-face meeting in two years is seen by Britain as a opportunity to reinforce support for the rules-based international system at a time when it says China’s economic influence and Russian malign activity threaten to undermine it.

On Monday, having met with Raab, U.S. Secretary of State Antony Blinken said there was a need to try to forge a global alliance of freedom loving countries, though stressed he did not want to hold China down, but make sure it played by the rules.

Elsewhere, the average number of new daily cases in the UK has fallen substantially since the start of the year, but the rate of decline has slowed in recent weeks. A further 1,649 confirmed cases in the UK were announced by the government on Monday.

Prime Minister Boris Johnson has said that the UK continues to make progress against Covid but the majority of scientific experts believe there will be another wave at some stage this year.

On the other hand, the dollar nursed losses on Tuesday after an unexpected slowdown in U.S. manufacturing growth prompted investors to trim bets that a booming U.S. economy could boost the greenback. Data showed shortages of basic materials and transport snarls depressed the Institute for Supply Management manufacturing survey by 4.7 points to 64.7.

GBP/USD 4 Hour Chart:

Support: 1.3829 (S1), 1.3748 (S2), 1.3697 (S3).

Resistance: 1.3961 (R1), 1.4012 (R2), 1.4093 (R3).

All the catalysts creates assorted view for pound against greenback and we expect a mixed trend for GBP/USD.

Urban Trading Strategy

The Urban trading strategy is just like its name. It is a trading strategy designed for traders who do not want to be get bothered by an overly complicated market strategy.

This strategy follows the trend and increases its win rate with the adoption of the very versatile Ichimoku Kinko Hyo indicator.

The Urban trading strategy focuses on triggering trade signals when two indicators are showing safe matching trade setups.

Timeframes : All

Instrument : You can trade any instrument

Indicators : Ichimoku Kinko Hyo(Colors Modified; Tenkan-sen=None, Kijun-sen=None, Chikou-Span=None), Awesome Oscillator (Default setting)

Long Entry Trading Rules :

  • When the sandy brown cloud of the Ichimoku Kinko Hyo Metatrader indicator stays somewhat below the candlesticks as we can trace on the chart below, bulls are meant to be formed by driving price higher, therefore a buy alert is said to be looming.
  • And If Awesome Oscillator is above zero horizontal level as shown on chart below, price is said to be driven to the upside, thus it is a trigger to buy the designated currency pair.
  • Placing a Stop Loss: Place stop loss below support.


Exit or Take Profit for Long Entry

  • When the Ichimoku Kinko Hyo indicator displays a thistle cloud while a bullish trend is running, bulls are meant to be leaving the market in their droves, as such an exit or take profit stance will suffice.
  • If Awesome Oscillator is above breaks below the 0.00 horizontal level during a bullish trend (as in the chart), it is signaling a likely end in bullish sentiments, thus an exit or take profit stance is duly recommended.


Let us explain with a chart below:

Short Entry Trading Rules :

  • When the thistle cloud of the Ichimoku Kinko Hyo indicator stays fairly above price bars as seen on below chart, bears are said to be formed and price is moving down therefore a signal to go short on the currency pair of interest.
  • And If Awesome Oscillator is below the zero horizontal level as depicted on chart, overall market sentiment is said to be bearish, thus it is a trigger to sell the selected instrument pair.
  • Placing a stop loss: Place stop loss above resistance.


Exit or Take Profit for Short Entry

  • When the Ichimoku Kinko Hyo technical indicator pops up a sandy brown cloud during the course of a bearish signal alert, bears is meant to be finished, hence it is a trigger to exit or take profit without delay.
  • When Awesome Oscillator is above the 0.00 horizontal level while a bearish trend is ongoing (as in the chart), it is signaling a likely end in bullish sentiments, thus a signal to exit or take profit at once.


Let us explain with a chart below:

Pros :

  • The Ichimoku Kinko Hyo indicator is an tool particularly designed for newbies who want to understand trend momentum, direction, pinpointing reversals and to locate entry levels on the chart.
  • The Awesome Oscillator indicator which delivers buy and sell signal when the trade above or below 0.00 horizontal level line.


Cons :

  • Al though it sounds easy to just ride the trend until the end, that’s seldom the case.
  • Because of the increase in volatility created by the breakout setup, it can be challenging to enter the market without slippage.