Australian Inflation figure disappoints the traders

Aussie fell today as Australia inflation figures disappointed traders during early Wednesday. Also adding to the Aussie’s weakness is the stimulus withdrawal pessimism and the Us dollar strength.

Australian consumer prices rose by much less than expected last quarter while core inflation increased by the weakest pace on record, which clearly signals monetary policy could stay super loose for a long time to come.

The consumer price index rose 0.6% in the March quarter from the prior three-month period, undershooting market forecasts for a 0.9% rise and also staying below 1.4% market expectations to 1.1%

The annual pace picked up to 1.1%, from 0.9%, but again missed forecasts of 1.4%, and remained far below the Reserve Bank of Australia’s (RBA) target band of 2-3%.

A key measure of trimmed mean inflation rose a surprisingly low 0.3% in the quarter, while the annual pace, at 1.1%, was the weakest on record.

Today global rating agency Fitch said that , “Withdrawal of central bank credit and QE measures pose the most serious risk for Australian credit markets over next 12 months.” On the other hand, Westpac mentioned,” We are forecasting that the RBA will extend its Quantitative Easing program (QE) with a third $100 billion program (QE3), which will begin in the first week of September.”

Elsewhere, After a call with the US Treasury Secretary Janet Yellen, the UK Finance Minister Rishi Sunak and New Zealand’s Finance Minister Grant Robertson, Australia’s Treasurer Josh Frydenberg said the media that “Today Australia hosted a call with the Finance Ministers of the United States , the United Kingdom and New Zealand.” This call built on our discussions from last year, to share experiences managing the COVID‑19 crisis.” During the call we exchanged views on our policy responses, and discussed our respective fiscal positions and strategies to support a robust economic recovery.” We agreed to remain in regular contact as a group and will continue to work together in responding to the challenges we face.”

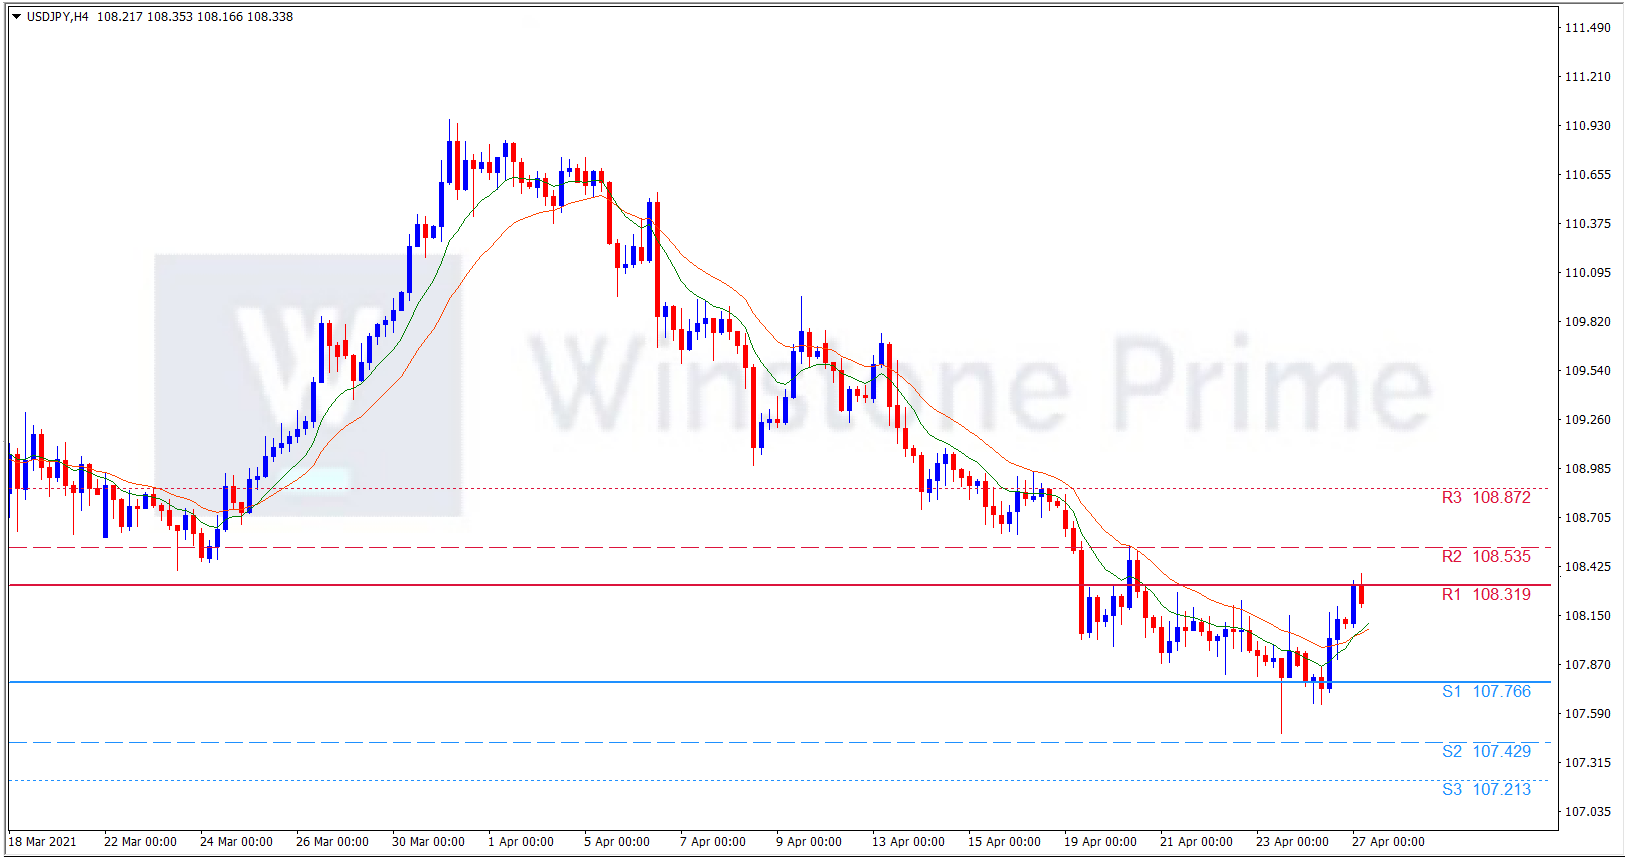
AUD/USD 4 Hour Chart:

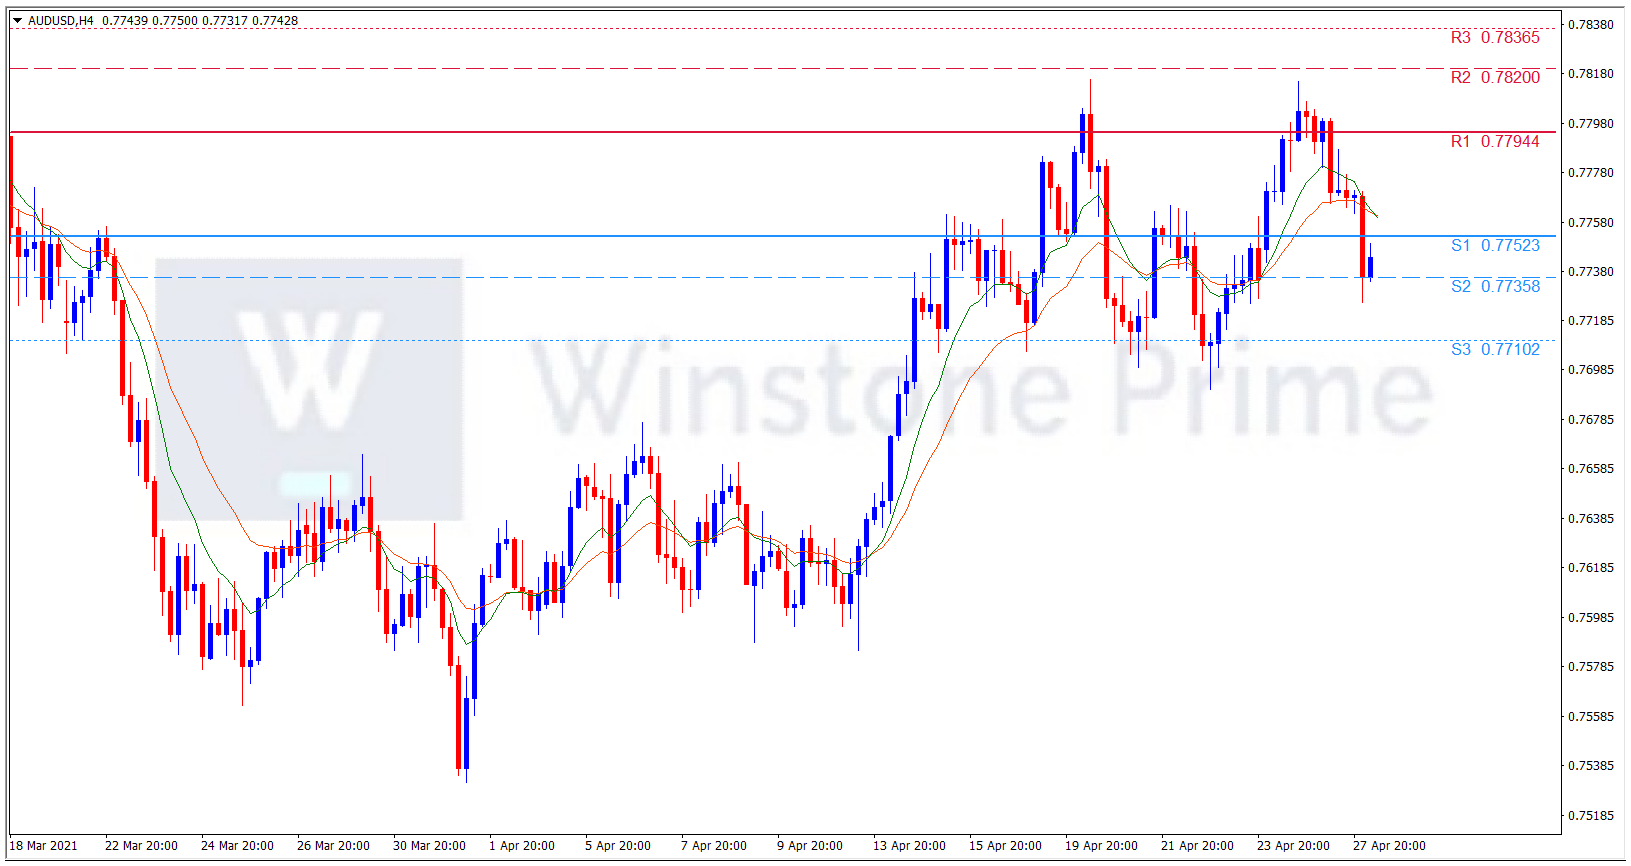
Support: 0.7752 (S1), 0.7736 (S2), 0.7710 (S3).

Resistance: 0.7794 (R1), 0.7820 (R2), 0.7837 (R3).

The Australia inflation data which rose concern among the traders and impacted Aussie negatively, we expect a bearish trend for AUD/USD.

Monetary policy impacts yen

Today, USD/JPY is stepping into bullish moment and the yen seems to struggle as a response to the monetary policy meeting. The Bank of Japan (BOJ) left its monetary policy settings untouched following the conclusion of its two-day April monetary policy review meeting on Tuesday.

Japanese shares looked to suffer on Tuesday as investors looked past upbeat corporate outlook amid worries about the government’s handling of the COVID-19 pandemic, while chip-related stocks took cues from a positive finish overnight on the Nasdaq. “There are uncertainties on the effect of the state of emergency that is imposed on certain parts of Japan, as many people seem to be ignoring it,” said an strategist.

Japan has imposed a third state of emergency on Tokyo and other big cities, against that the local media have reported many parts of Tokyo are still crowded as people aren’t complying with the order.

On the other hand, recent fears that the US Republicans may regain control in the Senate, which in turn raise challenges for further stimulus, was the major downer for Wall Street. However, unlock plans from the UK and the US as well as hopes that faster vaccinations will trigger a sooner economic recovery builds traders confidence.

Looking ahead, the BOJ’s tone in a statement and the economic outlook for the first quarter (Q1) will be closely watched after the nation recalled emergency in Tokyo and three other prefectures due to the covid resurgence. It should be noted that the BOJ is up for keeping its short-term rates with a target of -0.1% while also targeting 0.0% figures for the 10-year bond yield. Still, the BOJ will likely hold the view that the economy will recover at a modest pace, followed by a gradual pickup in inflation.

USD/JPY 4 Hour Chart:

Support: 107.77 (S1), 107.43 (S2), 107.21 (S3).

Resistance: 108.32 (R1), 108.54 (R2), 108.87 (R3).

The yen seems to react to the monetary policy update and the covid woes and trade downside. We expect a bullish trend for USD/JPY.

How to Day trade effectively with Pivot Points

It’s hard to fly when you can’t properly gauge your altitude. Pilots rely on instruments to measure how high or low they’re flying, particularly in cases where weather may prove challenging or dangerous. We can take this scenario as a metaphor and transfer it over to the currency markets.

In the currency markets, there are so many factors–from monetary and fiscal currents to geopolitics and global trade–that can affect weather conditions. You won’t be able to keep track of every change that occurs but you can measure altitude in relation to price events that either have occurred or are just unfolding.

One way to do this is to set daily pivot points to contextualize your short-term trades for the day and also you can set it accordingly for a week.

What is High or Low in Pivot Point?

Price action can be taking place simultaneously higher or lower depending on the context–compared to an indicator, historical price action, fundamental valuations pertaining to the base or quote currency, or a country’s place in the Big Mac index. It can be higher or lower depending on forward valuations, forecasts in the international trade environment, or expectations of central bank actions.

The point here is that there are a lot of possible reference points–and all of them are subject to change as the economy, like the market, is a dynamic beast.

As a forex day trader or swing trader, you may need a reference point that’s a bit more “fixed,” understanding that you’ll adapt to fluctuations as they occur around your fixed reference points.

And that’s why you might consider contextualizing your week using pivot points to help guide your short-term trading decisions. Before we jump into demonstrating application, let’s first go over the basics of pivot points, especially for those who may be less familiar with them.

Pivot Point Calculation

Let’s now discuss the way each of the five pivot points is calculated. First, we need to start with calculating the basic pivot level (PP)– the middle line.

PP Calculation

Below is the formula you should use to determine the PP level on your chart:

Pivot Point (PP) = (Daily High + Daily Low + Close) / 3

R1 R2 S1 S2 Pivot Levels Calculation

Now that we know how to calculate the PP level, let’s proceed with calculating the R1, R2, S1, and S2 pivot levels:

R1 = (2 x Pivot Point) – Daily Low

R2 = Pivot Point + (Daily High – Daily Low)

S1 = (2 x Pivot Point) – Daily High

S2 = Pivot Point – (Daily High – Daily Low)

R3 S3 Pivot Levels Calculation

We are almost done with the pivot point calculation. There are two more levels to go – R3 and S3.

R3 = Daily High + 2 x (Pivot Point – Daily Low)

S3 = Daily Low – 2 x (Daily High – Pivot Point)

See that the formulas for R1, R2, R3, S1, S2, and S3 all include the PP value.

This is why the basic pivot level is crucial for the overall pivot point formula. Therefore, you should be very careful when calculating the PP level. After all, if you incorrectly calculate the PP value, your remaining calculations will be off.

We have gone through the calculations above so that you can understand how these levels are calculated. We will now discuss some quick ways to calculate pivot points without having to do the manual calculations daily.

How to add Pivot Points in your Platform for Daily Trade

When you apply the basic pivot point and the three support and resistances, there will be 7 different levels. As you have seen above, it can be a bit tedious to perform the calculations manually. You can use MT4 or MT5 indicators to trace the pivot point easily or there are different options to get the pivot points without doing the calculation above manually.

There are many online pivot point calculators on the net. When you open a pivot point calculator, you will be required to add the three price action variables. These are the daily high, the daily low and the close. When you add these three, you will simply click on a “calculate” button and you will instantly get your pivot points. Once you have that, then you could just plot the pivot lines on your trading chart within your trading platform.

Trading Pivot Points

There are few basic rules when trading pivot points.

  • Be bearish when the price is below the main pivot point.
  • Be bullish when the price is above the main pivot point.
  • Go long if the price bounces from S1, S2, or S3.
  • Go short if the price bounces from R1, R2, or R3.


Have a look at the image below:

Since we have discussed the structure of the pivot points and the way they are calculated, it is now time to demonstrate pivot trading using some chart examples.

Conclusion

Pivot levels provide reference points, and using them on a daily and weekly scale can help you measure the proverbial altitude of price action over the entire week. Pivot points can help you gauge not only potential overbought and oversold areas, but also profit targets and entry levels. As we’ve demonstrated above, chart patterns take priority over pivot levels when it comes to trade signals. Pivot points are fixed, so be sure you’re monitoring the larger technical and fundamental context so that you can adjust to trading conditions, using your pivot points as a fixed point of reference.

You can calculate pivot point easily using winstone prime pivot calculator tool.

Happy trading!!

Being Tough on Brexit, EUR seems to be stronger

The European Union (EU) is gaining the trader’s attention with its strict stand versus the UK over Brexit ahead of the April 27 deal deadline.

Supporting the bloc is the headlines conveying the geopolitical risks in the South China Sea and willingness to welcome the US tourists during the summer holidays.

During earlier in Asia, the news came out which is suggesting Brussels push to Britain for an easy Brexit deal. As per the news, “Commission negotiators have told the UK that the EU will drop its demand for checks on food crossing into Northern Ireland if the government aligns itself with all EU plant, animal health, environment and food safety rules.”

BLoc is ready to welcome the US tourists, as per the New York Times (NYT). The news says, “American tourists who have been fully vaccinated against Covid-19 will be able to visit the European Union over the summer, the head of the bloc’s executive body said in an interview with The New York Times on Sunday, more than a year after shutting down nonessential travel from most countries to limit the spread of the coronavirus.”

On the other hand, The dollar fell on Monday amid speculation that U.S. Federal Reserve Chairman Jerome Powell will avoid talks of tapering bond purchases at a policy meeting this week.

Powell is about to encounter questions over whether an improving labour market and rising coronavirus vaccinations warrant a withdrawal of monetary easing, but most analysts expect him to say such talk is premature, which would put downward pressure on Treasury yields and the dollar.

The Fed’s next meeting will end on Wednesday, and no major policy changes are expected, traders will keep close watch to Powell’s comments after the meeting.

Rising coronavirus vaccination rates and an improving economic outlook are reasons to be optimistic, but many traders and analysts say Powell is likely to maintain the same stance of keeping easy policy in place for an extended period.

EUR/USD 4 Hour Chart:

Support: 1.2037 (S1), 1.1981 (S2), 1.1950 (S3).

Resistance: 1.2124 (R1), 1.2156 (R2), 1.2211 (R3).

The welcoming of Us visitors in summer and being tough against Brexit, EU seems to be stronger which helps it to gain strength against the weaker dollar. We expect a bullish trend for EUR/USD.