BTC/USD Weekly Forecast (26th April 2021 – 30th April 2021)

Fundamental view:

Bitcoin fell significantly during the course of the week. Market participants seem to be panic and are selling their holdings, sending the market into a tailspin. Bitcoin price witnesses two crashes in less than a week, Some unfounded sources stated that the U.S. Treasures would go after financial institutions for money laundering using cryptocurrencies. As market participants quickly realized this was a fluke, the market-wide sell-off was attributed to the power outage in Xinjiang. The next news was the news that federal capital gains tax rate would be as high as 39.6%, which is nearly a 100% bump from what investors currently pay, 23.80%.

All in all, the current Bitcoin price drop is concerning, no doubt. However, the massive inflow of institutional capital into the space combined with a large number of publicly traded companies supports the Flagship cryptocurrency.

The major economic events deciding the movement of the pair in the next week are Core Durable Goods Orders monthly report at April 26, CB Consumer Confidence Index at April 27, EIA Crude Oil Stocks Change, Fed Interest Rate Decision at April 28, GDP quarterly report, Initial Jobless Claims at April 29, and Employment Cost Index at April 30 for US.

BTC/USD Weekly outlook:

Technical View:

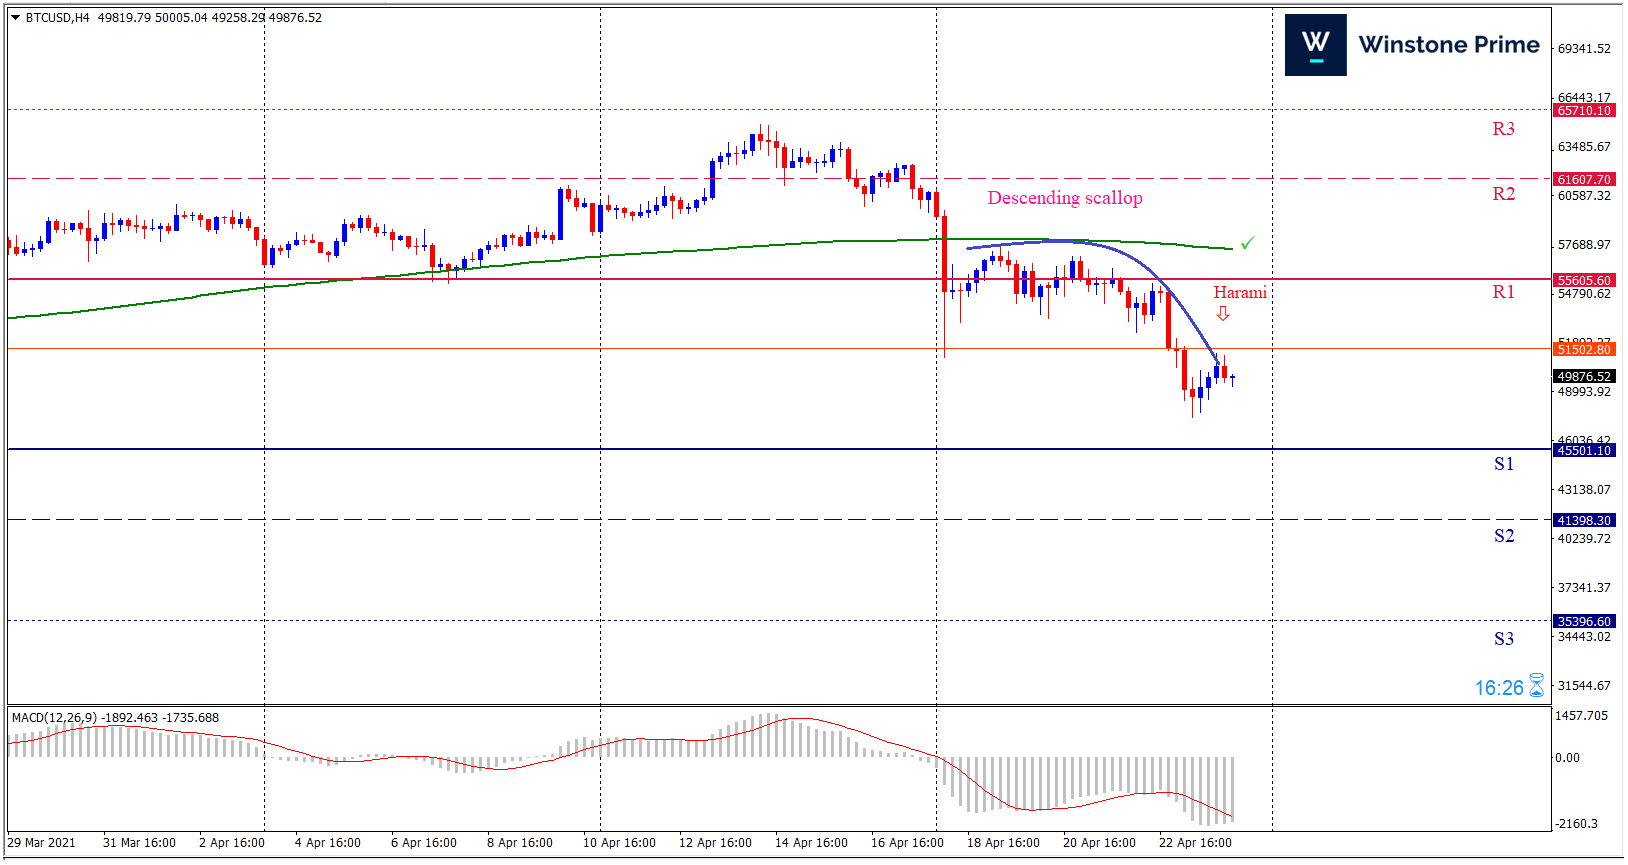
Last week’s high was 12.70% lower than the previous week. Maintaining high at 57504.5 and low at 47400.0 showed a movement of 10104 pips.

In the upcoming week we expect BTC/USD to show a bearish trend. The Instrument is trading below the 200 Simple Moving Average and the MACD trades to the downside. A solid breakout below 45501.1 may open a clean path towards 41398.3 and may take a way down to 35396.6. Should 55605.6 prove to be unreliable resistance, the BTCUSD may raise upwards 61607.3 and 65710.1 respectively. In H4 chart descending scallop pattern favors prospects of a bearish trend. Bearish harami pattern constructs a bearish outlook for the pair in the upcoming week.

Preference
Sell: 50115.8 target at 41399.3 and stop loss at 55610.6


Alternate Scenario
Buy: 55610.6 target at 65709.1 and stop loss at 50115.8

USD/JPY Weekly Forecast (26th April 2021 – 30th April 2021)

Fundamental view:

The US dollar has drastically fell against the Japanese yen in the past week. US Dollar weakness was a primary theme is the reason behind this trend.US dollar fell because the bond yield markets are going crazy occasionally. As US rates have eased, helped along by a Federal Reserve that’s confident in both rates and inflation being transitory themes that require no near-term action, USD/JPY has seen strong downside momentum.

US Existing Home Sales on 22nd April and US New Home Sales on 23rd April favored bullish trend for the pair whereas Japan Industrial Production monthly report on 19th April and Japan Markit Manufacturing PMI on 23rd April favored bearish trend for the pair.

The major economic events deciding the movement of the pair in the next week are US Core Durable Goods Orders monthly report at April 26, BoJ Interest Rate Decision,  Japan Retail Sales monthly report, US CB Consumer Confidence Index at April 27, Fed Interest Rate Decision at April 28, US GDP quarterly report at April 29, and US Employment Cost Index at April 30.

USD/JPY Weekly outlook:

Technical View:

Last week’s high was 0.86% lower than the previous week. Maintaining high at 108.83 and low at 107.48 showed a movement of 135 pips.

In the upcoming week we expect USD/JPY to show a bearish trend. The currency pair is trading below the 200 Simple Moving Average and the MACD trades to the downside. A solid breakout below 107.29 may open a clean path towards 106.71 and may take a way down to 105.94. Should 108.64 prove to be unreliable resistance, the USDJPY may raise upwards 109.41 and 109.99 respectively.  In H4 chart, Formation of bearish flag pattern indicates reversal of the trend creating prospects of a bearish trend Along with a bearish engulfing formation braces our expectation.

Preference
Sell: 107.88 target at 106.72 and stop loss at 108.69


Alternate Scenario
Buy: 108.69 target at 109.98 and stop loss at 107.88

AUD/USD Weekly Forecast (26th April 2021 – 30th April 2021)

Fundamental view:

The Aussie seesawed between bullish and bearish trend to end the week around 0.7760 level. The Australian currency has been stronger in the pandemic if it was not because of China.  Tensions between both countries, with the first pressuring to discover the origins of covid and the latter banning imports from the commodity-producer country. It should be noted that Australia suffered as much as any other major economy from the pandemic setback. The number of contagions and deaths is minimal compared to other countries, but at the expense of closing borders for over a year. Just in this week, the country resumed travelling with its neighbour New Zealand.

Reserve Bank of Australia has established an ultra-loose monetary policy that plans to maintain at least until 2024, when policymakers expect employment and inflation to return to more comfortable levels. Which also favored AUD.

US Chicago Fed National Activity Index on 22nd April and US Existing Home Sales on 23rd April created bearish trend for the pair whereas US EIA Heating Oil Stocks Change on 21st April and Australia Commonwealth Bank Manufacturing on 23rd April created bullish trend for the pair.

The major economic events deciding the movement of the pair in the next week are US Core Durable Goods Orders monthly report at April 26, US CB Consumer Confidence Index at April 27, RBA Weighted Median CPI quarterly report, Fed Interest Rate Decision at April 28, US GDP quarterly report at April 29, RBA Private Sector Credit monthly report and US Employment Cost Index at April 30.

AUD/USD Weekly outlook:

Technical View:

Last week’s high was 0.70% higher than the previous week. Maintaining high at 0.7816 and low at 0.7691 showed a movement of 125 pips.

In the upcoming week we expect AUD/USD to show a bullish trend.  The currency pair is trading above the 200 Simple Moving Average and the MACD trades to the upside. A solid breakout above 0.7804 may open a clean path towards 0.7872 and may take a way up to 0.7929. Should 0.7679 prove to be unreliable support, the AUDUSD may sink downwards 0.7622 and 0.7554 respectively. In H4 chart symmetrical triangle breakout upside favors prospects of a bullish trend. Also to be noted Bullish hammer formation exerts the expectation of uptrend for the pair.

Preference
Buy: 0.7728 target at 0.7851 and stop loss at 0.7674


Alternate Scenario
Sell: 0.7674 target at 0.7555 and stop loss at 0.7728

XAU/USD Weekly Forecast (26th April 2021 – 30th April 2021)

Fundamental view:

Gold markets have gone back and forth during the course of the week. With the benchmark 10-year US Treasury bond yield continuing to edge lower, however, gold advanced to its highest level. In the absence of high-tier macroeconomic data releases, XAU/USD continued to react to fluctuations in the US T-bond yields.  US President Joe Biden was planning to propose an increase in capital gains tax to pay for a major spending plan for families that will be announced next week.

In the upcoming week, Market participants will pay close attention to the Core Personal Consumption Expenditures (PCE) Price Index, the Federal Reserve’s preferred gauge of inflation, on Friday. Earlier in the month, the Consumer Price Index (CPI) data eased fears over price pressures becoming uncontrollable in the near term and caused US Treasury bond yields to push lower.              

The major economic events deciding the movement of the pair in the next week are Core Durable Goods Orders monthly report at April 26, CB Consumer Confidence Index at April 27, EIA Crude Oil Stocks Change, Fed Interest Rate Decision at April 28, GDP quarterly report, Initial Jobless Claims at April 29, and Employment Cost Index at April 30 for US. 

XAU/USD Weekly outlook:

Technical View:

Last week’s high was 0.79% higher than the previous week. Maintaining high at 1797.9 and low at 1763.6 showed a movement of 343 pips.

In the upcoming week we expect XAU/USD to show a bullish trend.  The Instrument is trading above the 200 Simple Moving Average and the MACD trades to the upside. A solid breakout above 1795.3 may open a clean path towards 1813.8 and may take a way up to 1829.6. Should 1761.0 prove to be unreliable support, the XAUUSD may sink downwards 1745.2 and 1726.7 respectively. In H4 chart ABCD pattern formation favors prospects of a bullish trend. Also to be noted Bullish harami formation exerts the expectation of uptrend for the pair.

Preference
Buy: 1774.8 target at 1802.9 and stop loss at 1756.2


Alternate Scenario
Sell: 1756.2 target at 1727.7 and stop loss at 1779.6