USD/JPY Weekly Forecast (29th March 2021 – 2nd April 2021)

Fundamental view:

Greenback continued to be in uptrend in the early part of the week  but Thursday’s finished at 109.23 and it set the stage for an easy traverse on Friday and it ran straight to the 12-month high. American Treasury rates and improved US data were the main source of dollar strength. The massive support the Bank of Japan (BOJ) is providing to equity prices may be having the opposite effect on perception, by adding strength to the yen.

US Chicago Fed National Activity Index on 22nd March and US Durable Goods Orders monthly report on 24th March framed bearish atmosphere for the pair whereas US GDP quarterly report and US initial Jobless claims on 25th and Japan Tokyo CPI yearly report framed bullish trend for the pair.

The major economic events deciding the movement of the pair in the next week are Japan Retail Sales monthly report at Mar 29, US CB Consumer Confidence Index at Mar 30, BoJ Tankan Large Manufacturing Index, US ADP Nonfarm Employment Change at Mar 31, US Initial Jobless Claims, US ISM Manufacturing PMI, OPEC Meeting at April 01 and US Nonfarm Payrolls at April 02.

USD/JPY Weekly outlook:

Technical View:

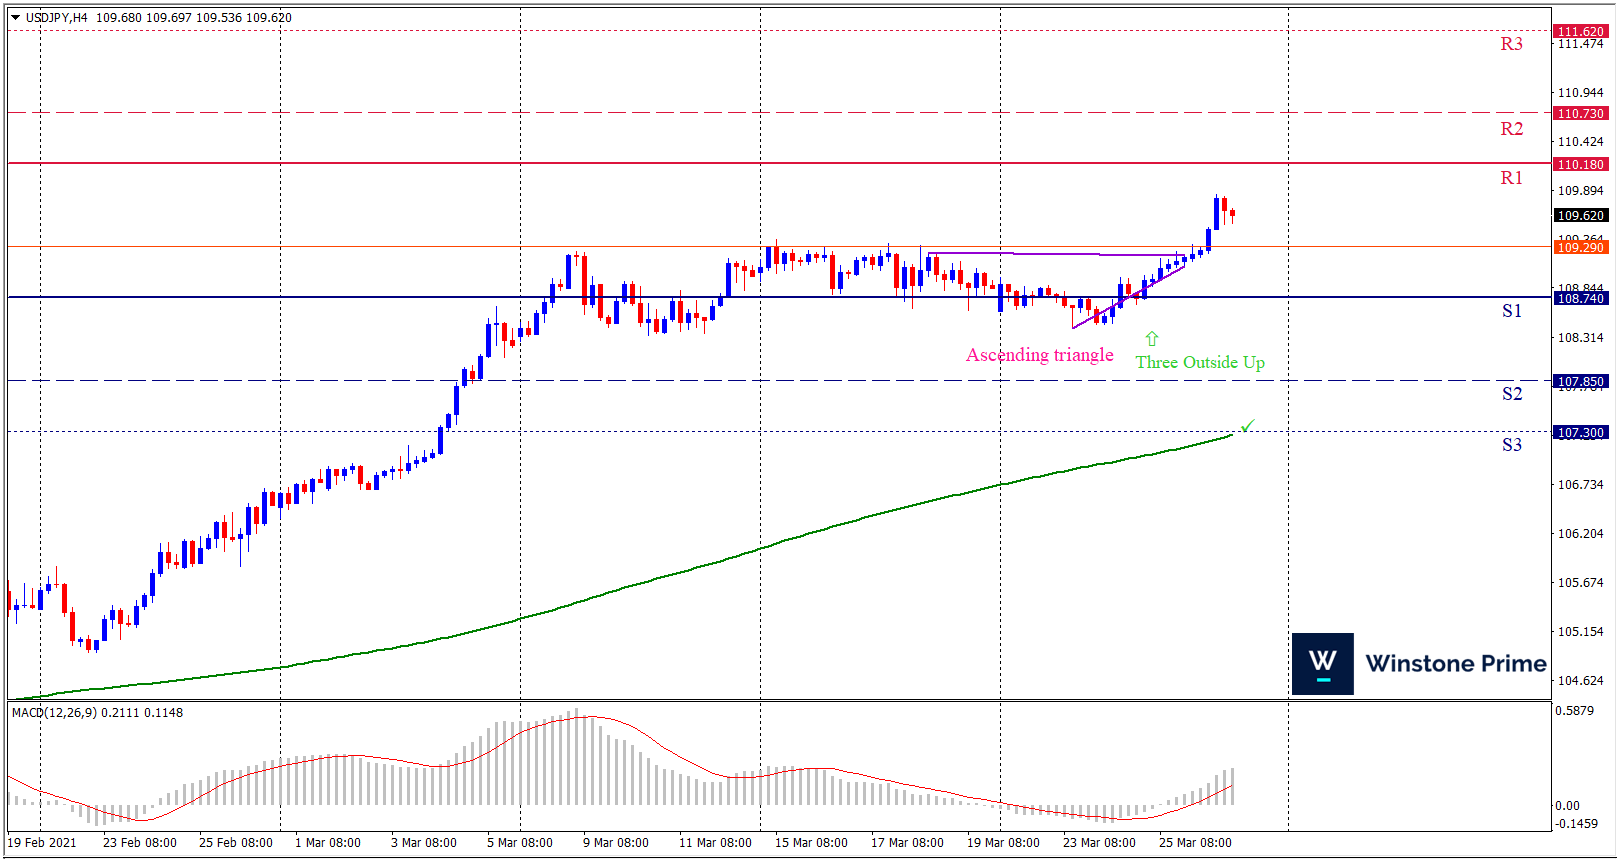
Last week’s high was 0.44% higher than the previous week. Maintaining high at 109.85 and low at 108.41 showed a movement of 144 pips.

In the upcoming week we expect USD/JPY to show a bullish trend. The currency pair is trading above the 200 Simple Moving Average and the MACD trades to the upside. A solid breakout above 110.18 may open a clean path towards 110.73 and may take a way up to 111.62. Should 108.74 prove to be unreliable support, the USDJPY may sink downwards 107.85 and 107.30 respectively. In H4 chart, Formation of ascending triangle pattern breakout creating prospects of a bullish trend Along with a three outside up pattern formation braces our expectation.

Preference
Buy: 109.51 target at 110.72 and stop loss at 108.69


Alternate Scenario
Sell: 108.69 target at 107.31 and stop loss at 109.51

AUD/USD Weekly Forecast (29th March 2021 – 2nd April 2021)

Fundamental view:

The Australian dollar fell during the week reaching to the 0.76 level. The dollar is in uptrend as greenback has been building on infrastructure plans to rise, and more data are due in the upcoming week along with  the all-important Nonfarm Payrolls report. Greenback remains strong even though there was a fall in yield. The world’s reserve currency has been benefiting from US President Joe Biden massive $3 billion infrastructure plan.

US Durable Goods Orders on 24th March and US EIA Natural Gas Storage Change on 25th March favored uptrend for the pair whereas US Existing Home Sales on 22nd March and US Wholesale Inventories on 26th March favored downtrend for the pair.

The major economic events deciding the movement of the pair in the next week are US CB Consumer Confidence Index at Mar 30, RBA Private Sector Credit monthly report, US ADP Nonfarm Employment Change at Mar 31, Australia Retail Sales monthly report, US Initial Jobless Claims, US ISM Manufacturing PMI, OPEC Meeting at April 01 and US Nonfarm Payrolls at April 02.

AUD/USD Weekly outlook:

Technical View:

Last week’s high was 1.18% lower than the previous week. Maintaining high at 0.7757 and low at 0.7563 showed a movement of 194 pips.

In the upcoming week we expect AUD/USD to show a bearish trend.  The currency pair is trading below the 200 Simple Moving Average and the MACD trades to the downside. A solid breakout below 0.7546 may open a clean path towards 0.7457 and may take a way down to 0.7352. Should 0.7740 prove to be unreliable resistance, the AUDUSD may raise upwards 0.7845 and 0.7934 respectively. In H4 chart bearish shark pattern favors prospects of a bearish trend. Also to be noted shooting star formation exerts the expectation of downtrend for the pair.

Preference
Sell: 0.7633 target at 0.7458 and stop loss at 0.7745


Alternate Scenario
Buy: 0.7745 target at 0.7933 and stop loss at 0.7633

EUR/USD Weekly Forecast (29th March 2021 – 2nd April 2021)

Fundamental view:

Euro showed a bearish trend against greenback in the previous week. Europe’s worsening covid conditions and another upcoming US infrastructure boost have put pressure on the Euro. COVID-19 cases are increasing in the old continent, and it has been weighing on the euro. After Italy and France imposed new restrictions on most of their populations, Germany extended its lockdown through April 18.

US Existing Home Sales on 22nd March and US Core PCE Price Index yearly report on 26th March created bullish trend for the pair whereas Europe Industrial New Orders monthly report & US Richmond Fed Manufacturing Index on 23rd March and US Wholesale Inventories monthly report & US Michigan Consumer Sentiment on 26th March created bearish trend for the pair.

The major economic events deciding the movement of the pair in the next week are US CB Consumer Confidence Index at Mar 30, Europe Unemployment Rate, US ADP Nonfarm Employment Change at Mar 31, US Initial Jobless Claims, Europe Markit Manufacturing PMI US ISM Manufacturing PMI, OPEC Meeting at April 01 and US Nonfarm Payrolls at April 02.

EUR/USD Weekly outlook:

Technical View:

Last week’s high was 0.34% than the previous week. Maintaining high at 1.1947 and low at 1.1762 showed a movement of 185 pips.

In the upcoming week we expect EUR/USD to show a bearish trend. The currency pair is trading below the 200 Simple Moving Average and the MACD trades to the downside. A solid breakout below 1.1721 may open a clean path towards 1.1649 and may take a way down to 1.1536. Should 1.1906 prove to be unreliable resistance, the EURUSD may raise upwards 1.2019 and 1.2091 respectively. Chart formation of a head and shoulders pattern in H4 chart sets prospects for a bearish trend. Shooting star formation in H4 chart escalates the expectation for a bearish trend.

Preference
Sell: 1.1800 target at 1.1650 and stop loss at 1.1911


Alternate Scenario
Buy: 1.1911 target at 1.2090 and stop loss at 1.1800

BTC/USD Weekly Forecast (29th March 2021 – 2nd April 2021)

Fundamental view:

Bitcoin fell against greenback in the previous week.  It fell due to the positive sentiment for the greenback. Ray Dailio, founder of the world’s largest hedge fund, Bridgewater Associates, warned that BTC could be banned in the United States if it becomes too successful. He paralleled it to the 1934 Gold Reserve Act, which made it illegal for investors to own gold because the government did not want gold to compete with money and credit as a store of wealth.

In the meantime, India continued to debate a national ban on BTC and other digital assets, leading some experts like HashCash CEO Raj Chowdry to say the ban would have grave implications for the future of the economy and result in currency devaluation “of the worst form.”

The major economic events deciding the movement of the pair in the next week are CB Consumer Confidence Index at Mar 30, ADP Nonfarm Employment Change, EIA Crude Oil Stocks Change at Mar 31, Initial Jobless Claims, ISM Manufacturing PMI at April 01 and Nonfarm Payrolls at April 02 for US.

BTC/USD Weekly outlook:

Technical View:

Last week’s high was 3.95% lower than the previous week. Maintaining high at 58349.1 and low at 50333.7 showed a movement of 8016 pips.

In the upcoming week we expect BTC/USD to show a bearish trend. The Instrument is trading below the 100 Simple Moving Average and the MACD trades to the downside. A solid breakout below 50557.7 may open a clean path towards 46438.0 and may take a way down to 42542.3. Should 58573.1 prove to be unreliable resistance, the BTCUSD may raise upwards 62468.8 and 66588.5 respectively. In H4 chart diamond chart pattern breakout favors prospects of a bearish trend. Shooting star pattern constructs a bearish outlook for the pair in the upcoming week.

Preference
Sell: 54450.4 target at 46439.7 and stop loss at 58578.1


Alternate Scenario
Buy: 58578.1 target at 66587.5 and stop loss at 54450.4