Pound is in uptrend ahead of UK Retail sales

GBP/USD made a recovery against the loss during early Friday. While doing so, the quote enjoys the recent recovery in the market sentiment.

Market sentiment is boosted as hopes of further stimulus join the Fed’s strong rejection of reflation fears. Also adding the optimism in the market sentiment is the US President Joe Biden’s push for faster vaccinations and upbeat US data.

The data published by the US Department of Labor showed on Thursday that the weekly Initial Jobless Claims dropped to 684,000 in the week ending March 20, the lowest reading since the beginning of the pandemic. Additionally, the US Bureau of Economic Analysis revised its fourth-quarter GDP growth to 4.3% from 4.1%.

China has sanctioned organizations and individuals in the United Kingdom over what it called “lies and disinformation” about Xinjiang, after Britain imposed sanctions for human rights abuses in the western Chinese region. This has served to be factor in boosting the GBP/USD bull.

A British diplomat shared the news that the nation’s export of meat and seafood to the bloc nations recovered in February against the January slump.

The comments from the Confederation of British Industry (CBI) suggesting expectations for retail sales turning positive in March for the first time since December 2019 added to the optimism. 

As per Reuters, Britain pledged a further 1.5 billion pounds ($2.06 billion) in tax relief for companies hit by the coronavirus crisis but which until now had not qualified for exemption from paying business rates, a charge based on the value of commercial property. The move comes on top of the 16 billion pounds in business rates relief already paid to or earmarked for retail, hospitality and leisure businesses.

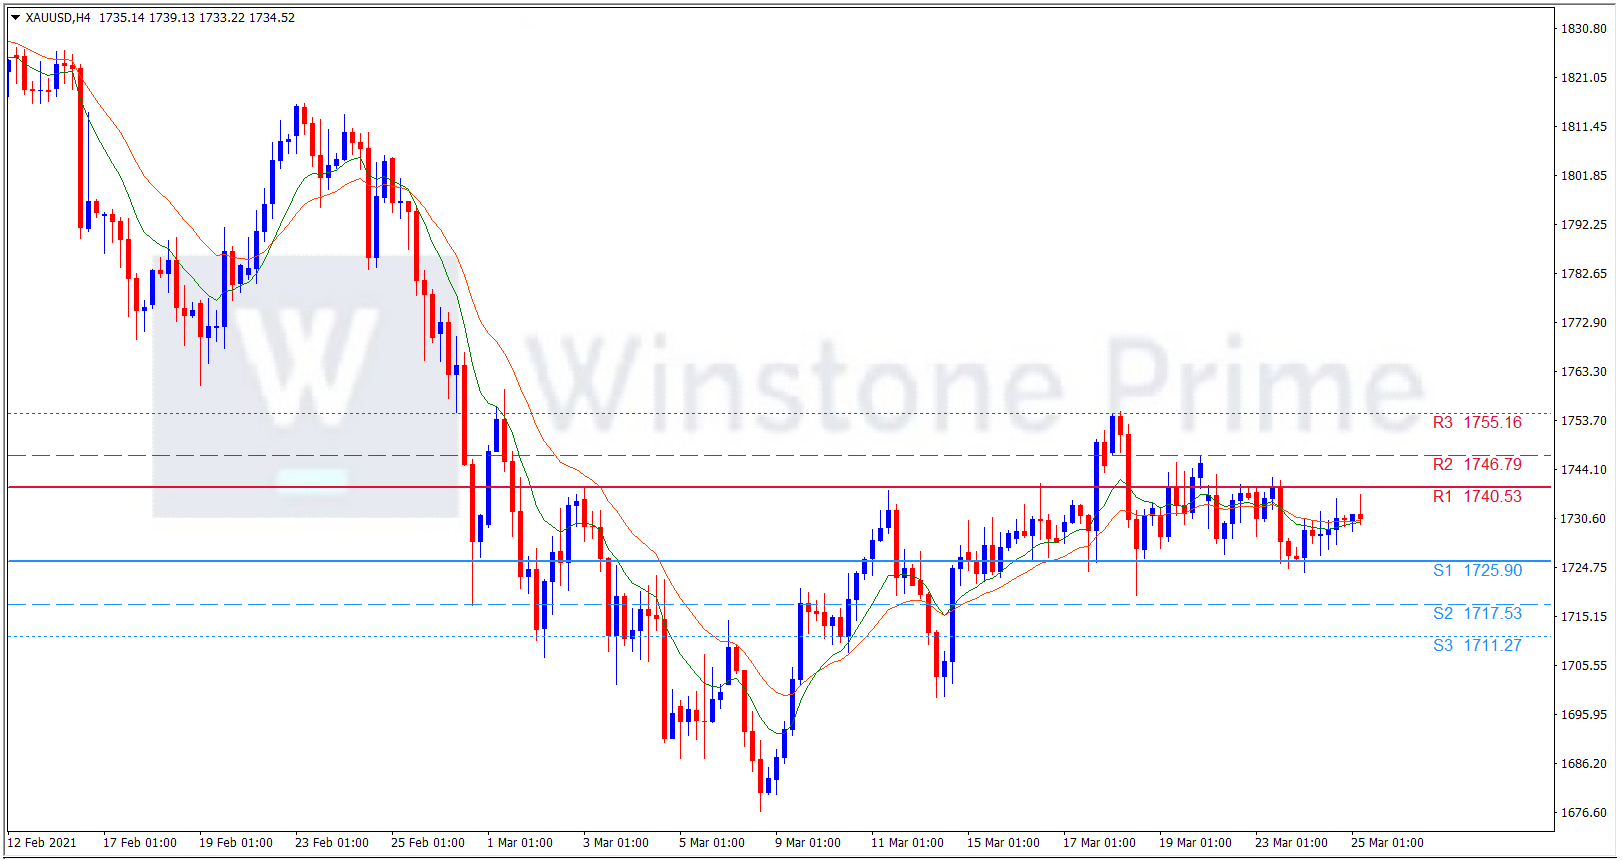
GBP/USD 4 Hour Chart:

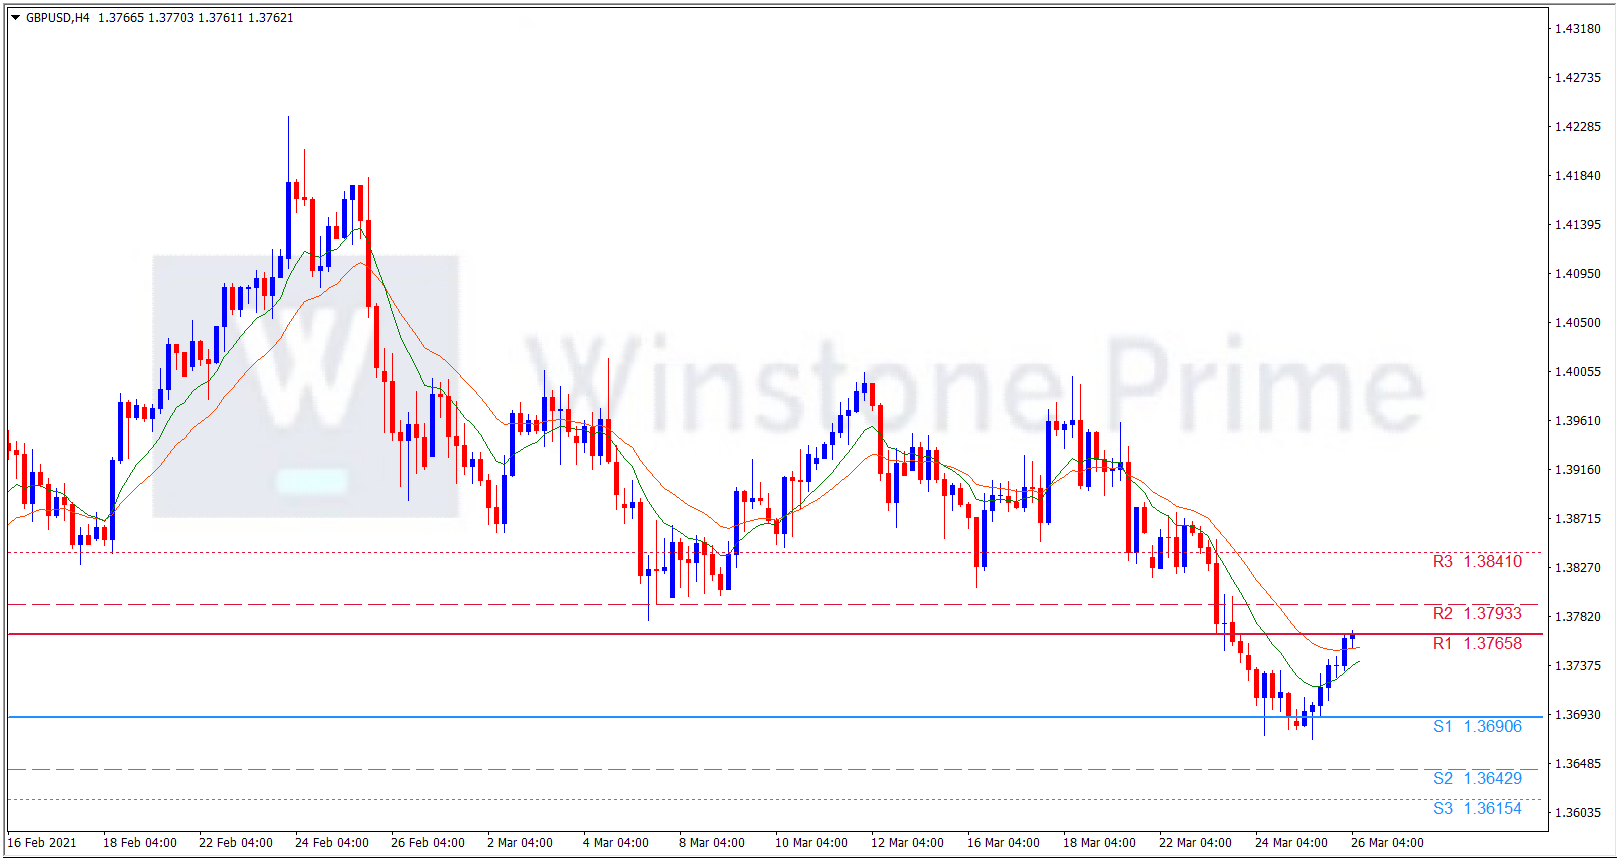
Support: 1.3691 (S1), 1.3643 (S2), 1.3615 (S3).

Resistance: 1.3766 (R1), 1.3793 (R2), 1.3841 (R3).

All the catalysts favors Britain pound against the American dollar and traders will now keep an eye on the Britain Retail sales data. We expect a bullish trend for GBP/USD.

US 10 yr yield highs making gold to struggle

The yellow metal struggles to find consistent bullish momentum. One of the gold market analyst said that investors should stop paying attention to the irrational selloff in the bond market and instead focus on long-term fundamentals as global deficits and debt continue to grow.

George Milling-Stanley, chief gold strategist at State Street Global Advisors, said that gold investors have an unhealthy focus on 10-year bond yields. He also said that once the spotlight shifts away from the bond-market selloff, he expects gold prices to continue to move higher.

Although 10-year yields have recently pushed to a 13-month high, representing the most considerable risk for the gold market, Milling-Stanley said that he is not convinced that the bond market selloff is sustainable in the long-term.

“I know two people who are not completely confident about the robustness of the economic recovery. One of them is me, which is not very important. And the other one is Jerome Powell, the chair of the Federal Reserve,” he said.

 In US, the preliminary PMI readings for March have been mostly stronger than expected which favors the greenback but Fears of slower economic recovery out of the coronavirus (COVID-19) and decrease of bond purchasing, as well as a rate hike, were among the major challenges to the market sentiment. Also on the negative side were US-China trade war fears and Beijing’s tussles with the Western leaders, comprising the US, the UK, Canada and the European Union (EU) and  new lockdowns in Germany, France, and Italy and rising cases in many US states.

On the other hand, US President Joe Biden’s vaccine optimism over a $3.0 infrastructure plan to keep the traders hopeful. Adding optimism to the market is the news that the US Senate is voting to extend the Paycheck Protection Program (PPP) beyond March expiry. Also, Australia’s easing of the covid restrictions and American policymakers’ rush to join links with Western friends, also connecting with ex-China allies in Asia, favors the market sentiment.

XAU/USD 4 Hour Chart:

Support: 1725.9 (S1), 1717.5 (S2), 1711.3 (S3).

Resistance: 1740.5 (R1), 1746.8 (R2), 1755.2 (R3).

Gold struggles and shows a bullish trend against greenback amidst of all the catalysts creating mixed sentiment for greenback. We expect a bullish trend for XAU/USD.

Diamond Chart Trading Strategy

The Diamond Chart trading strategy is a reversal price action pattern which is rare to spot on the activity chart.

This pattern is triggered in the form of a diamond top (bearish signal) and diamond bottom (bullish signal), and usually marks a period of congestion before a new trend emerges in the market.

 Timeframes : All

Instrument : you can trade any instrument

Indicators : cci (Input Variable modified; InpMaPeriod = 40, InpVolatilityPeriod = 70, InpCCIPeriod = 60)

Long Entry Trading Rules :

  • First step : If the Diamond Bottom price action pattern forms (shown by the points on the chart A, B, C & D), price is said to be in uptrend, hence the breakout is displayed in the chart.
  • Second step : If the blue histogram of the cci_ custom indicator aligns above the 0.00 signal level, price is said to be experiencing somewhat bullish sentiment, thus a buy signal. Place a buy trade now.
  • Stop Loss for Buy Entry: Then place stop loss 5 pips below mid-point between the measured distance between point B and C.


Take Profit or Exit for Buy Entry

  • From the projected breakout point D, the take profit target is estimated as the distance between points B and C. In our example below, our take profit target was hit which is shown via the blue horizontal line drawn on the chart.
  • If the deep pink histogram of the cci_ custom indicator gets aligned below the 0.00 signal level, price is said to be reversing from its current bullish stance, thus an exit or take profit is advisable.


Let us explain with a chart below:

Short Entry Trading Rules :

  • First Step : If the Diamond Top price action pattern forms (shown by the points on the chart A, B, C & D), price is said to be on downtrend, hence the breakout is displayed on below chart.
  • Second Step : If the dark pink histogram of the cci_ custom indicator aligns below the 0.00 signal level, price is said to be experiencing somewhat bearish sentiment, hence a sell signal. Place a sell trade now.
  • Stop Loss for Sell Entry: Then Place stop loss 5 pips above mid-point between the measured distance between point B and C.


Take Profit or Exit for Sell Entry 

  • From the projected breakout point D, the take profit target is estimated as the distance between points B. In the image, our take profit target was hit, shown as the point on the blue horizontal line drawn on the chart below.
  • If the blue histogram of the cci_ custom indicator forms above the 0.00 signal level, price is said to be reversing from its current bearish stance, thus an exit or take profit is advisable.


Let us explain with a chart below:

Pros :

  • The diamond top and bottom are reversal patterns that are used to pin bearish and bullish breakouts respectively.
  • A diamond pattern is an advanced chart formation that occurs in the financial markets used for detecting reversals.


Cons :

  • The biggest mistake a trader can make is trading too early before the diamond pattern gets formed completely. 
  • Risk in trading a diamond pattern is in calculating and setting price targets and stop-losses.
  • Identifying the Diamond pattern requires a sharp eye and lots of practice.

Mixed market sentiment keeps USD/JPY flat

US data was disappointing with the lower-than-expected new Home Sales which declined 18.2% MoM in February, well below expectations of a 5.7% drop.

”Part of this drop reflects freezing weather conditions in February reducing activity in some parts of the US, alongside limited supply. The median sales price rose 5.3% YoY,” said an Analyst.

In the meantime, the lockdowns in Europe and Fed Chair Powell’s comments downplaying the effects of inflation resulted into the mix on a choppy day for Wall Street. Opposite to Fed’s Powell, Dallas Fed’s Kaplan who is a non-voter was advocating hikes and as one of the Fed officials signalling a hike in 2022 in the dot plot projections. Kaplan anticipates 6% growth for 2021, unemployment at 4%, inflation between 2.25% and 2.5%, and 10yr yields between 1.75% and 2.00%.

On the other hand, As per a private sector survey on Wednesday, an expansion of Japan’s factory activity gathered pace in March which is helped with the prospect of a global economic recovery because increasing number of countries roll out COVID-19 vaccines.

But the service sector remained depressed, with businesses suffering from the coronavirus pandemic’s fallout even after the government lifted a state of emergency in the Tokyo region.

Elsewhere, The Bank of Japan need to seek ways to encourage corporate investment to promote digitalisation and a carbon-free society, one of its board members said at a January meeting, suggesting that the idea could emerge as a future policy option.

Meeting for a rate review weeks after the government rolled out fresh curbs to prevent the spread of the coronavirus pandemic, BOJ policymakers warned of various risks that cloud their projections of a moderate economic recovery.

“It’s important to encourage corporate activities for future growth such as research and development investment, business portfolio reforms, and efforts on digitalisation and decarbonisation,” one of the members was quoted as saying.

“It’s crucial for the BOJ to devise monetary policy means to boost firms’ and households’ growth expectations by showing its determination to never allow a return to deflation,” the member said. Another member, however, said it was “not easy” to use monetary policy to address the structural challenges faced by Japan’s economy, the minutes showed.

USD/JPY 4 Hour Chart:

Support: 108.39 (S1), 108.16 (S2), 107.92 (S3).

Resistance: 108.86 (R1), 109.10 (R2), 109.32 (R3).

All the catalysts creates mixed market sentiment confusing the yen traders. As of now, we expect a mixed trend for USD/JPY.

.