Greenback weakens ahead of FOMC decision

Goldman Sachs says in a latest preview for Wednesday’s key Federal Open Market Committee (FOMC) meeting,  “The Fed needs to see substantial further progress on employment and inflation to conclude that tapering is appropriate, which is unlikely to happen until the second half of 2021.”

This report also says that the US central bank may want to give ample warning before the first taper, likely in Q4 2021 or Q1 2022. As per the review “The FOMC’s tolerance for any future tightening in financial conditions might be somewhat greater than usual at a time when activity is picking up and powerful growth impulses from reopening, fiscal stimulus, and pent-up savings are set to support the economy all year.”

US Secretary of State Antony Blinken on Wednesday said that China is acting more aggressively and more repressively, including East China and the South China Sea.

On Tuesday, Blinken said that the US will push back when China uses coercion and aggression to get its way, in his address to the American embassy staff in Tokyo.

On the other hand, in the previous week, a very strong employment report supported the CAD. The headline rate rose 259.2k, topping expectations of 75k, while this was led by the part-time jobs increase, there was also good gains in full-time employment. Meanwhile the unemployment rate fell to 8.2%, significantly below expectations of 9.2%.

Also few days ago the Bank of Canada’s March policy decision came in as expected, with interest rates held steady and asset purchases unchanged. The accompanying statement recognized the resilience of the Canadian economy and stronger than expected economic growth, while also noting that considerable slack and a great deal of uncertainty remains. The BoC Governing Council noted that despite improvements in the economic outlook, “the recovery continues to require extraordinary support.”

USD/CAD 4 Hour Chart:

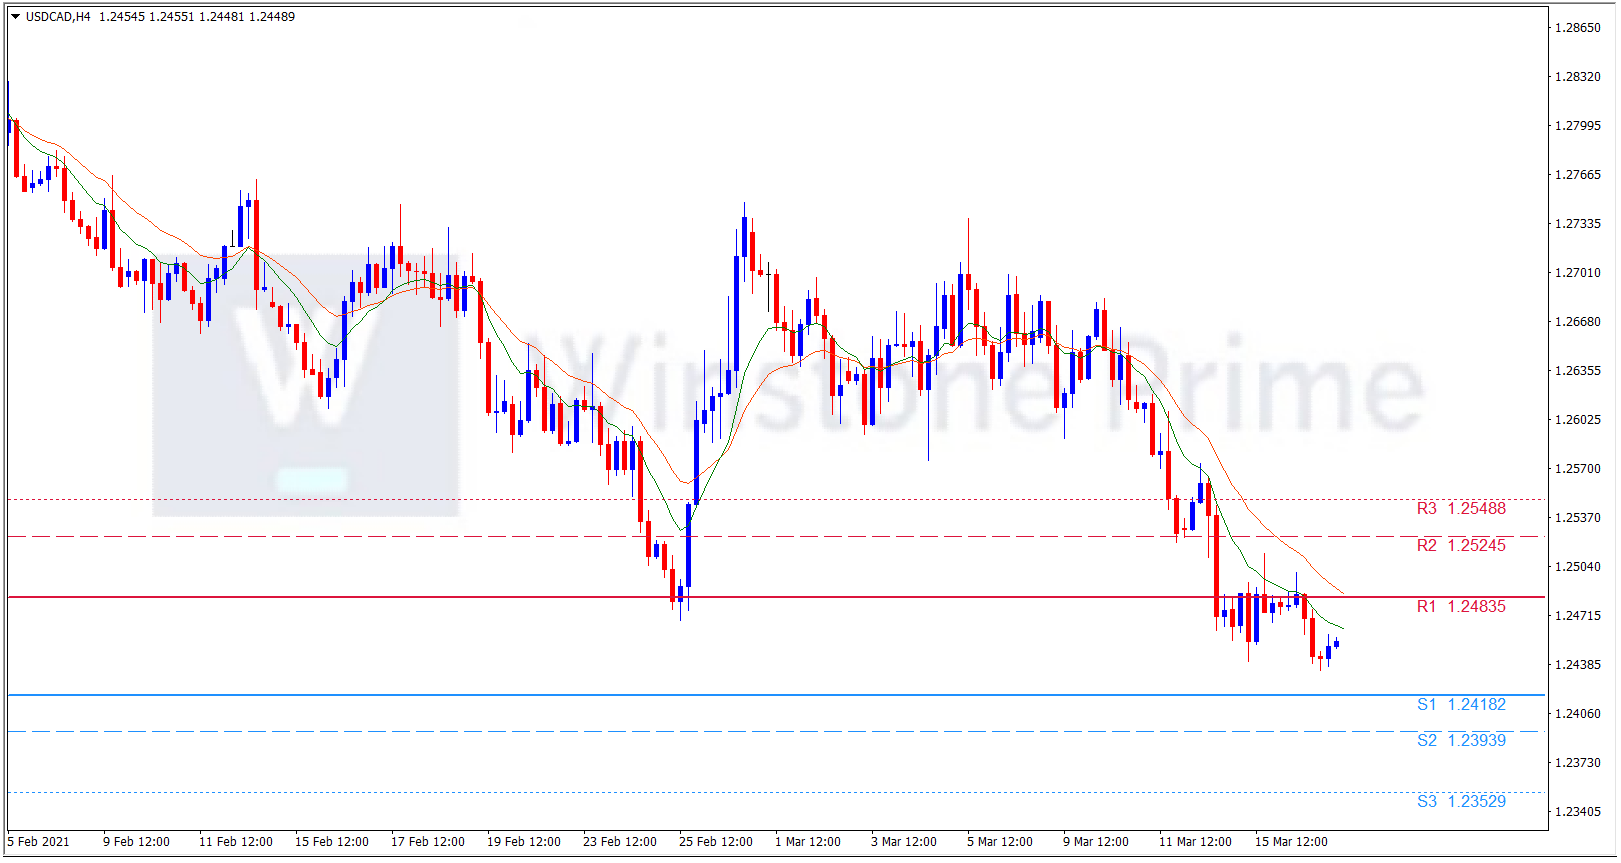
Support: 1.2418 (S1), 1.2394 (S2), 1.2353 (S3)

Resistance: 1.2484 (R1), 1.2525 (R2), 1.2549 (R3).

In the prevailing environment which favors the Canadian dollar against the American dollar, we expect a bearish trend for USD/CAD.

Japan PM Suga’s speech impacts Yen

The Japanese government is about to decide on Thursday on whether to lift the coronavirus pandemic-induced state of emergency, as the emergency in Tokyo and surrounding regions is set to end on March 21, a news was reported.

This came after Tokyo reported 175 new COVID-19 cases Monday, which fell below 200 for the first time in a week and a day after reporting 239 infections. On Sunday, the daily number of newly confirmed cases nationwide came to 989, standing below 1,000 for the first time in six days.

Elsewhere, Japan’s Prime Minister (PM) Yoshihide Suga while speaking at a government meeting on Tuesday. Said that he will decide next week whether to utilize the JPY500 billion ($4.58 billion) in reserve funds for targeted payments. The measures covers payments of JPY50,000 to single-parent and low-income households as well as aid for work training and food banks, PM Suga added.

On the other hand, The U.S. dollar clung to small gains on Tuesday before of the major central bank meetings, beginning with a two-day Federal Reserve gathering due to start later in the global day.

Expectations are running low for monetary policymakers to shift from their accommodative stance despite forecasts of rapid economic growth in the wake of an accelerating COVID-19 vaccine roll-out and a $1.9 trillion pandemic relief package.

“The market is really sitting tight waiting for the Fed decision, because the huge move in U.S. bond yields has been so key that the market really needs to see what they plan to do” said a strategist.

USD/JPY 4 Hour Chart:

Support: 108.91 (S1), 108.69 (S2), 108.46 (S3)

Resistance: 109.36 (R1), 109.59 (R2), 109.81 (R3).

Amidst all the catalysts creating confusion among the yen traders. We expect a mixed trend for USD/JPY.

Untold secrets of Price action Trading

Price action is one of the most popular trading concepts in today financial market. A trader who knows how to use the pricing process the right way can often improve his performance and the way he looks at charts. Whether you are a short-term or long-term trader, analysing the price of a security is perhaps one of the simplest, yet also the most powerful, ways to gain an edge in the market. However, misconceptions and half-truths that confuse traders and lead to failure are still circulating.

Here we are going to look into some of the untold secrets of price action trading concept. Let’s have a look on this.

A price action trader generally sets great store in human fallibility and the tendency for traders in the market to behave as a crowd. For instance, a trader who is bullish about a certain currency might observe that this currency is moving in a range from $20 to $30, but the traders expects the currency to rise to at least $50. Many traders would simply buy the currency, but then every time that it fell to the low of its trading range, would become disheartened and lose faith in their prediction and sell. A price action trader would wait until the currency hit $31.

price-action-2

In a modern-day market, the price action trader would first be alerted to the market once the price has broken out to $31, but knowing the counter-intuitiveness of the market and having picked up other signals from the price action, would expect the stock to pull-back from there and would only buy when the pull-back finished and the market moved up again.

Support, Resistance, and Fibonacci levels are all important areas where human behavior may affect price action. “Psychological levels”, such as levels ending in .00, are a very common order trigger location. Several strategies use these levels as a means to plot out where to secure profit or place a Stop Loss. These levels are purely the result of human behaviour as they interpret said levels to be important.

One key observation of price action traders is that the market often revisits price levels where it reversed or consolidated. If the market reverses at a certain level, then on returning to that level, the trader expects the market to either carry on past the reversal point or to reverse again. The trader takes no action until the market has done one or the other.

It is considered to bring higher probability trade entries, once this point has passed and the market is either continuing or reversing again. The traders do not take the first opportunity but rather wait for a second entry to make their trade. For instance the second attempt by bears to force the market down to new lows represents, if it fails, a double bottom and the point at which many bears will abandon their bearish opinions and start buying, joining the bulls and generating a strong move upwards.

Also as an example, after a break-out of a trading range or a trend line, the market may return to the level of the break-out and then instead of re-joining the trading range or the trend, will reverse and continue the break-out. This is also known as ‘confirmation’.

“Trapped traders” is a common price action term referring to traders who have entered the market on weak signals, or before signals were triggered, or without waiting for confirmation and who find themselves in losing positions because the market turns against them. Any price action pattern that the traders used for a signal to enter the market is considered ‘failed’ and that failure becomes a signal in itself to price action traders, e.g. failed breakout, failed trend line break, failed reversal.

It is assumed that the trapped traders will be forced to exit the market and if in sufficient numbers, this will cause the market to accelerate away from them, thus providing an opportunity for the more patient traders to benefit from their duress. “Trapped traders” is therefore used to describe traders in a position that will be stopped out if price action hits their stop loss limit. The term is closely linked to the idea of a “trap” which Brooks defines as: “An entry that immediately reverses to the opposite direction before a scalper’s profit target is reached, trapping traders in their new position, ultimately forcing them to cover at a loss. It can also scare traders out of a good trade.”

Since many traders place protective stop orders to exit from positions that go wrong, all the stop orders placed by trapped traders will provide the orders that boost the market in the direction that the more patient traders bet on. The phrase “the stops were run” refers to the execution of these stop orders. Since 2009, the use of the term “trapped traders” has grown in popularity and is now a generic term used by price actions traders and applied in different markets – stocks, futures, forex, commodities, cryptocurrencies, etc.

Trading steps for Price action

Many of the experienced traders following price action trading keep multiple options for recognizing trading patterns, entry and exit levels, stop-losses and related observations. Having just one strategy on one or may be multiple currency may not offer sufficient trading opportunities. Most scenarios involve a two-step process. First we need to identify the scenario of price moment. Like a currency price getting into a bull/bear phase, channel range, breakout, etc. Second one is within the identified scenario we can find the trading opportunities. Like once a currency pair is in Bull Run, is it likely to (a) overshoot or (b) retreat. This is a completely subjective choice and can vary from one trader to the other, even given the same identical scenario.

Some example of it

  • A currency pair reaches its high as per the trader’s view and then retreats to a slightly lower level (scenario met). The trader can then decide whether they think it will form a double top to go higher, or drop further following a mean reversion.
  • The trader sets a floor and ceiling for a particular stock price based on the assumption of low volatility and no breakouts. If the stock price lies in this range (scenario met), the trader can take positions assuming the set floor/ceiling acting as support/resistance levels, or take an alternate view that the stock will breakout in either direction.
  • A defined breakout scenario being met and then trading opportunity existing in terms of breakout continuation (going further in the same direction) or breakout pull-back (returning to the past level).


As can be seen, price action trading is closely assisted by technical analysis tools, but the final trading call is dependent on the individual trader, offering flexibility instead of enforcing a strict set of rules to be followed.

Conclusion

 Do you want to earn a little extra income? The good news is if you know what to look for in today’s market you can achieve your goals with just a few hours a day.  But you need to know how price action trading works, and how to analyse order flow like professional traders. Even if you see the best price action signal, you can still greatly increase your odds by only taking trades at important and meaningful price levels. Most amateur traders make the mistake of taking price action signals regardless of where they occur and then wonder why their win rate is so low.

Most of those tips are probably not considered price action secrets by advanced traders, but amateurs can usually improve the quality of their trading and how they view the markets by just picking a few of them. Price action trading is a powerful tool and is the basis for numerous strategies used by traders all around the world. Is it time for you to incorporate it into your trading with our Platform Winstone Prime. We have a complete education platform ready for you, including all the guidelines for new traders, live support and application for mobile, Updated articles and Daily market updates.  You can use the instruments and grab your profit.

RBA Governor’s speech weighs on AUD

Aussie falls after RBA Governor Philip Lowe’s speech during the early Monday. Although RBA’s Lowe tried to sell the Aussie government’s policies, his comments over inflation and employment seem to have weighed on the AUD.

The Reserve Bank of Australia’s governor Philip Lowe said on Monday that the central bank is doing what it can to support the country’s economic recovery from the coronavirus pandemic and will maintain policy settings until it meets its employment and inflation goals. He said that “The result has been a quicker and stronger economic recovery than was expected. This, however, does not hide the fact that we still have a long way to go.”

“The challenges facing all are large,” Lowe said in the speech in Melbourne. “At the Reserve Bank, we are seeking to support the economic recovery and a stronger labour market that is consistent with achieving the inflation target.”

Adding the pressure on the Aussie, Australian shares fell on Monday, hurt by losses among mining and technology stocks, Investors are now waiting for the release of minutes from the central bank’s monetary policy which will be done by Tuesday.

On the other hand, Upbeat data of china comes in, China’s Retail Sales crosses 32.0% forecasts and 4.6% prior with 33.8% YoY figures for January. Further details suggest that Industrial Production also rallied in January from 7.3% prior and 3.3% expected to 35.1% YoY.

The U.S. dollar held firm on Monday after bouncing off a one-week low last week, supported by a spike in benchmark Treasury yields to more-than-one-year highs as inflation fears continued to smoulder.

U.S. producer prices had their largest annual gain in nearly 2-1/2 years, data showed on Friday, while the country’s economy is set to get a massive shot in the arm from President Joe Biden’s $1.9 trillion stimulus package. The outlook for the already brisk pace of U.S. vaccinations has also been boosted by Biden’s order for every state to make all adults eligible for vaccination by May 1.

AUD/USD 4 Hour Chart:

Support: 0.7721 (S1), 0.7685 (S2), 0.7645 (S3)

Resistance: 0.7798 (R1), 0.7838 (R2), 0.7874 (R3).

Upbeat Chinese data can support Aussie but US dollar strength and US Treasury yields puts pressure on the Aussie. We expect a bearish trend for AUD/USD.