Relation between Stock Market and Forex Market

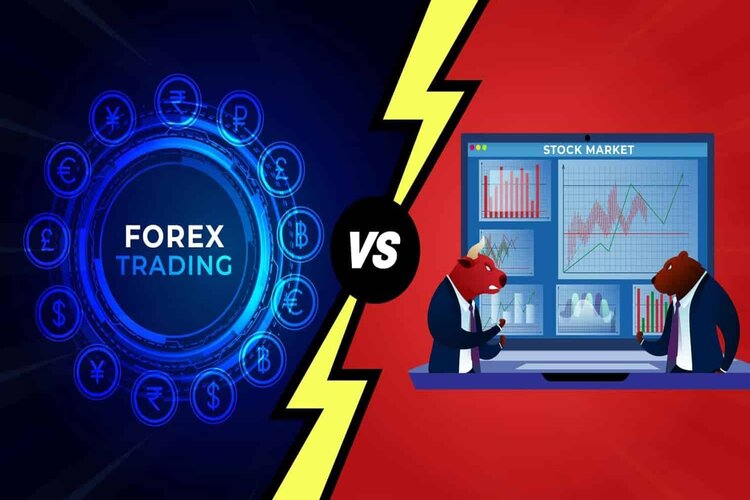
Stock trading and foreign exchange or “forex” trading, are similar in that they depend on taking advantage of constantly changing prices – but that’s where the similarities largely end. Understanding the differences between forex and stock trading can help you to decide whether one type of trading may be more suitable to your goals and style as a trader than the other. Forex traders are always looking for trends and economic outlooks to predict the potential movement in a currency. Some look at economic reports, the gross domestic product (GDP), or trade relations, but you might be able to predict these reports using the equity markets. Equity markets have thousands of firms around the world producing hundreds of reports every day that can be a useful source of information for currency traders.

In this article, we’ll cover the correlation of Stock market and forex market. Here we have given detail many ways in which it differs from equities trading.

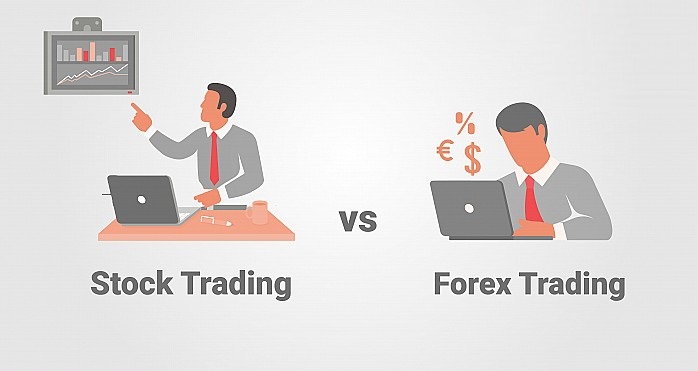
Stock Market trading is different from Forex trading

While you may already be aware of what stocks are and how they work, a refresher never hurts. A stock is an investment security that represents an ownership share in the company it’s issued by. When you purchase a stock in a business or corporation, that equity makes you a shareholder. Stocks are typically bought, sold, and traded on stock exchanges, such as the New York Stock Exchange (NYSE) or NASDAQ.

You can make a profit on stocks by receiving regular dividend payments, (if a company’s stock issues them), or by selling your shares on the stock market for a higher price than you bought them. While some stocks are riskier than others, this type of security often makes up the majority of investors’ portfolios. Most stocks see the best performance when held for a longer period of time, as in many years, so they have time to recover from possible short-term market volatility.

The foreign exchange markets are truly a global market; bigger than any other securities market. So when thinking about equities and their influence on forex markets, you truly have to think globally. The best companies to consider are naturally the ones with international operations that transact in various currencies. For example, as the biggest retailer on the planet, Walmart deals with foreign exchange issues just as much as any other company you could think of. Another great name is Coca-Cola. These global consumer stocks transact with consumers all over the world and provide the best corporate glimpse into the forex market.

The commodities market can also be useful with respect to the forex market. Consider the main global commodity, crude oil. Global oil prices are denominated in U.S. dollars. As an example, the price of oil can spike because the value of the U.S. dollar declines relative to major global currencies. So the price of oil has to go up in order to equalize the price that other foreign countries buy in their home currencies. While other global commodities—sugar, corn, and wheat—offer similar insights, oil is the most significant commodity that relates to the foreign exchange markets.

A major equity market can also influence forex markets in another way. A weak currency favors exporters in that particular country. When your domestic currency is weak, exports are cheaper abroad. That helps fuel the growth and profits of those exporters. When earnings are growing, equity markets tend to do well. Of course, the situation is most likely to occur in equity markets backed by the major global currencies: the U.S. dollar, the yen, the euro, and the British pound, among others.

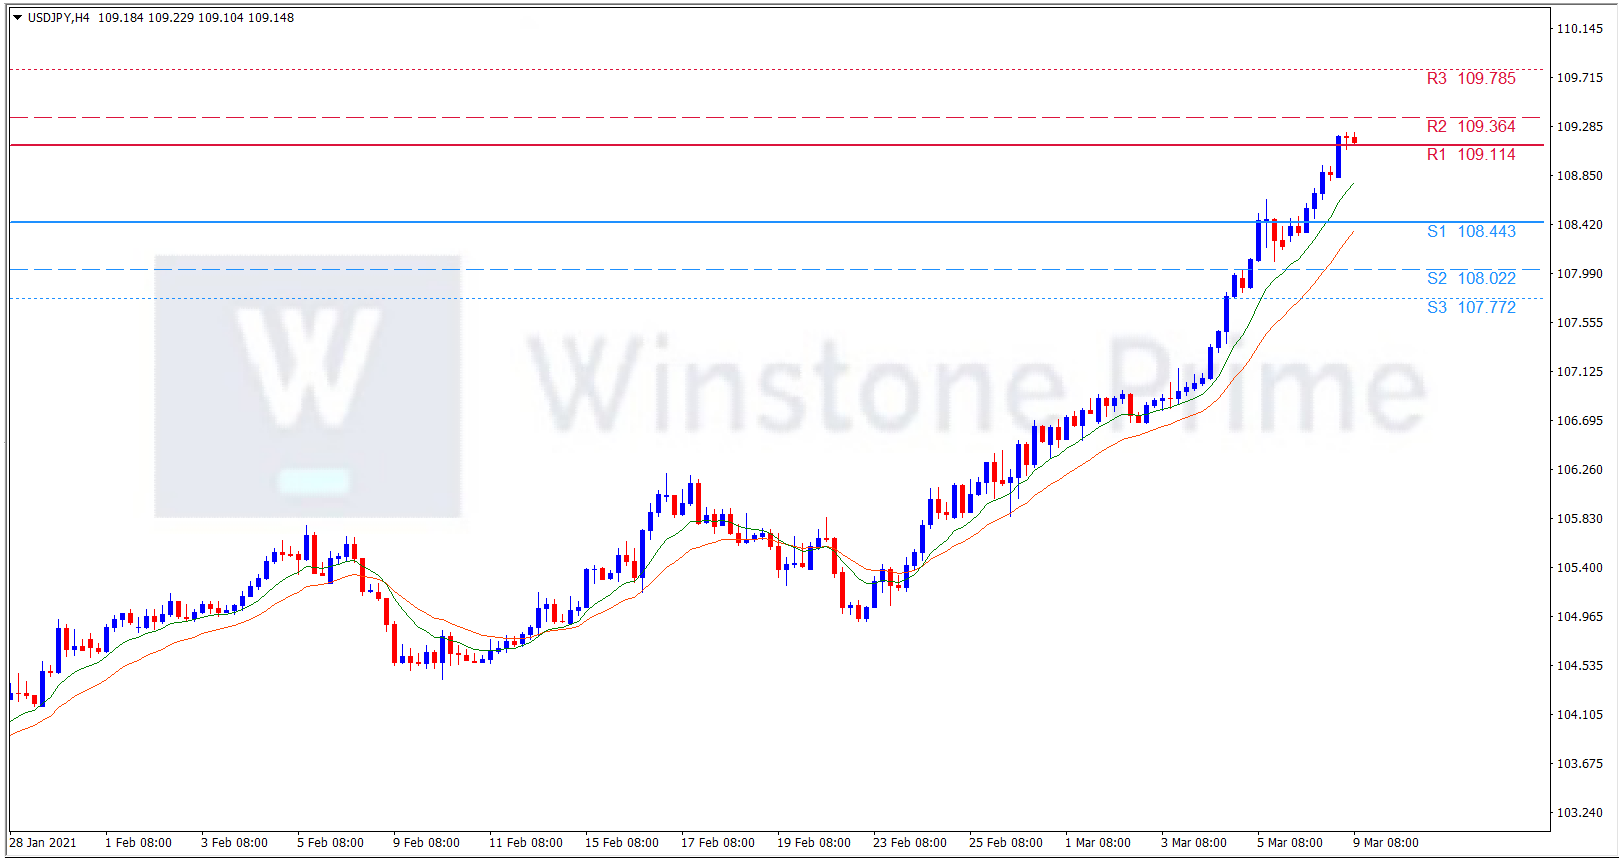
While stocks may be traded globally, the market for equities is largely national rather than international. Forex, on the other hand, operates on a global market. This is aided by the fact that forex trading occurs 24 hours a day, so that it is possible for forex traders to trade across any currency depending on the time of day and what brokers are active. On the other hand, while there are typically thousands of stocks to choose from on a single exchange, forex trading revolves largely around 18 pairs of currencies that have particularly high liquidity. The 18 pairs of high liquidity currencies are USD/CAD, EUR/USD, USD/CHF, GBP/USD, NZD/USD, AUD/USD, USD/JPY, EUR/CAD, EUR/AUD, EUR/JPY, EUR/CHF, EUR/GBP, AUD/CAD, GBP/CHF, GBP/JPY, CHF/JPY, AUD/JPY, AUD/NZD. So these are all the mostly traded pairs.

Forex and Share markets are entirely different markets; there is a significant relationship between the stocks and the forex market. The performance of the domestic currency is directly correlated to the performance of the country’s stock market. When a country’s stock market performs well, there will be capital inflows from foreign investors who intend to earn higher returns.

To invest in the domestic economy, the foreign investors will have to convert their money into local currency; hence, increasing the domestic currency demand in the forex market. In turn, the value of the domestic currency will also increase.

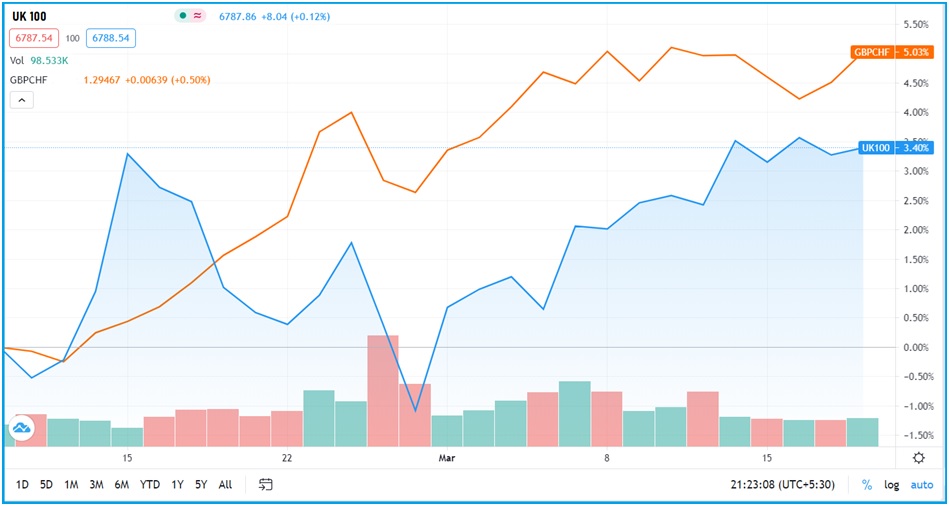
Conversely, when the stock market is on a downtrend, it will result in capital flight by foreign investors who want to avoid further losses. The capital flight can also result from foreign investors’ profit-taking when they believe that the stock market has reached its peak. When exiting the domestic stock market, the foreign investors convert their capital to other currencies, which results in an increase in supply in the forex market hence depreciation. Furthermore, when the stock markets open, it coincides with the Forex market hours in different time zones. During these forex sessions, forex pairs with the domestic currency experience higher liquidity than when the local stock markets are closed.

Forex market is a huge ocean of institutions, investors and consumers trading currencies. Movements in the market reflect the total demand for one currency relative to other currencies.

Currencies only rise or drop relative to other currencies. When people say the pound is weak, they’re speaking in reference to other major currencies. So, for instance, the pound could drop in value relative to dollars, while remaining the same against some other currencies.

There are lots of factors that influence currency movements, including:

  • Whether a currency is inflationary (i.e. loses buying power over time)
  • Central bank interest rates (relative to interest rates in other countries)
  • Consumer demand for spending in that currency
  • Whether a country imports or exports more
  • Simple trading momentum in the short-term
  • Demand for assets and investments priced in that currency


To apply these factors to the recent pound decline: if investors don’t want to buy UK-denominated assets, like property or UK government debt, or invest in the UK, then the demand for pounds goes down.

If consumers and companies don’t want to or can’t import as much from the UK, then the demand for pounds could go down too. All this means that currency performance can often (but not always) reflect the world’s opinion of a country’s economic future.

That’s not necessarily what’ll happen, but these sorts of predictions seem to be the calculation the market is making right now, or at least what they fear. In theory, currency moves should have a balancing aspect. When currencies weaken because of economic concerns and lack of demand for assets and exports, that makes those assets and exports relatively cheaper, stimulating demand again.

Similarities between Forex and Stocks

Although forex and stock trading are marked mostly by their differences, they do share some characteristics in common. Both forex and stock trading involve taking advantage of short-term shifts in prices to generate profit, and in the process entail risk that the stock or currency you are holding will fall in value from the purchase price rather than rise. In addition, much like stock trading, forex traders rely heavily on technical analysis in order to identify probably price movements and inform trading behavior. Finally, trading both forex and stocks requires a strong fundamental understanding of how markets work and practice in order to turn a consistent profit.

Forex markets are complex dynamic markets. Equities can be useful indicators, but investors should be aware that equities alone may not be sufficient to provide an accurate assessment. This serves as a reminder that we should always take into account fundamentals, technical’s, and market sentiment, so always read up! Don’t take correlations for granted because they aren’t a sure-fire thing!

Happy Trading!

Support & Resistance level breakout Trading Strategy

The support and resistance level breakout trading system is a price action trading system; it is one of the simplest and easiest trading setups to spot and trade.

This support and resistance level breakout trading strategy is different from the horizontal support and resistance trading strategy in which you trade the bounce of the price on the support and resistance levels.

Support Level Breakout

A support level breakout is when a price breaks a support level and continues to head down, in a downtrend.

Hence when a support level is broken, it means the market is in a downtrend.

Resistance Level Breakout

A resistance level breakout is a price breaks a resistance level and continues to head up, in a uptrend.

Hence when a resistance level is broken, it means the market is said to be in an uptrend.

Timeframes : Preferable to use 1 Hr, but you can use small time frame also.

Instrument : you can trade any instrument

Trading Rules for the Support and Resistance Breakout :

Trading breakout is really simple. Remember Support breakout is for sell trades and Resistance breakout is for buy trades.

  • The pink boxes represent support levels (image 1) and resistance levels (image 2).
  • And the blue arrow indicates the candlestick that broke the support level (image 1) and resistance level (image2) and closed below/above it.
  • Identify the support level /resistance level and you can draw a horizontal line if you wish to.
  • For Support breakout, take note of the breakout candlestick when price comes down and touches that support level. The breakout candlestick is that closes below the support line after intersecting it.
  • For resistance breakout, take note of the breakout candlestick when price head up and touches that resistance level. The breakout candle stick is that close above the resistance level after intersecting it.
  • Then place a sell stop order 2 pips below the low of the breakout candlestick for support breakout or place a buy stop order 2 pips above the high of the breakout candlestick for resistance breakout.
  • After that, place your stop loss 2 pips above/below the high/low of the breakout candlestick or just 2 pips above the high of the nearest swing high.
  • Take profit should be atleast 2-3 times what you risked or you can make use of trailing stop technique to ride out the trend if you want.


Image 1: Support Breakout

Image 2 : Resistance  Breakout

Additional Notes on stop loss placement:

  • When you place stop loss 2 pips above/below the high/low of the breakout candlestick. The advantages will be tight stop loss and this may increase your risk:reward greatly when your trade goes well. But problem with this is that it may be close to the entry price level and you may get stopped out prematurely.
  • Or when you place stop loss 2 pips above/below the high/low of the nearest swing high. The advantage is that you have less chance of getting stopped out from a trade prematurely. The big problem here is that sometimes, the stop loss distance to the nearest swing high will be large and this reduces your risk:reward ratio as well because price has to move a lot of distance in the direction of your trade before you even reach a 1:1 risk:reward ratio.


Pros :

  • When a breakout trade is successful, there is a possibility of large gains. Getting in on a strong trend early can be a profitable situation.
  • Usually Breakout trades present themselves during consolidating market phases. Initial stop losses may be relatively small according to the compressional pattern or price range being used for market entry. In addition, confirmation of a trade’s failure may come rapidly, offering an opportunity for a quick exit.


Cons :

  • Optimal trade setups may not occur frequently. Searching for setups can often leave a trader on the sidelines instead of pursuing other opportunities.
  • False breakouts are a considerable part of this approach. No matter how sound the methodology used in identifying a breakout is, quantifying market follow-through is largely subjective. In few instances, a signal may appear to be solid but end up lacking the increased participation needed to succeed.

Downbeat comments of RBA’s Lowe weighs AUD

Upbeat data of China’s inflation released during early Wednesday did not support the Aussie. China’s Consumer Price Index (CPI) was same as previous month maintained at 0.6% while rising-0.2% YoY versus -0.6 % expected. Adding to it, the Producer Price Index (PPI) followed the suit with a record of 1.7% versus 0.7% forecast.

It should also be noted that Australia’s Westpac Consumer Confidence grew past-1.8% forecast and 1.9% prior readings to flash 2.6% but even this data failed to support the Aussie.

Australia’s A$2 trillion ($1.5 trillion) economy expanded by a larger-than-expected 3.1% in the December quarter, clocking its fastest ever back-to-back quarterly rises. Job growth has been sturdy while retail sales are going strong too.

“These better-than-expected outcomes are very welcome news,” the Reserve Bank of Australia’s (RBA) governor, Philip Lowe, said in a speech in Sydney.

“However, they do not negate the fact that there is still a long way to go and that the Australian economy is operating well short of full capacity.”

The remarks come as financial markets begin pricing in rate hikes on the back of strong economic data and optimism about successful coronavirus vaccine rollouts. Lowe noted the recent surge in Australian bond yields that were boosted by expectations of possible increases in the cash rate as early as late next year, saying, “This is not an expectation that we share.”

Even so the policymaker said, “The economy was now within a striking distance of its pre-pandemic output.”

On the other hand, In the view of the analysts at Morgan Stanley, the US economic growth is likely to return to the pre-coronavirus pandemic level by the end of this month.

Market sentiment turns slow after the previous day’s optimism surrounding America’s $1.9 trillion relief bill. The same seems to have favored the US dollar to consolidate recent losses while also restricting the US 10-year Treasury yields around 1.53%.

AUD/USD 4 Hour Chart:

Support: 0.7645 (S1), 0.7581 (S2), 0.7541 (S3).

Resistance: 0.7750 (R1), 0.7790 (R2), 0.7855 (R3).

Even tough there are some favorable catalysts for Aussie; it seems to react to the downbeat comments of the RBA Governor’s speech and to the favorable US relief bill. We expect a bearish trend for AUD/USD.

Rise in Us Treasury yield weighs on Yen

The yen’s woes continue, as the US dollar continues to beat up on the Japanese currency. The main catalyst behind the recent strength of the US dollar has been the recent rise in US Treasury yields. While the 10-year bond climbed to 1.60% earlier on Monday, 30-year bonds has rose to 2.31%. The Japanese yen is particularly sensitive to rate differentials between the US and Japan, thus increases in US yields are putting strong pressure on the Japanese currency.

The Senate passed a massive 1.9 trillion dollar stimulus package on Saturday. The bill now returns to the House for some amendments, and will likely to be signed into law by President Biden by March 14. This news supports the greenback positively.

A surprisingly strong US Nonfarm Payrolls last week has provided the US dollar with further upward momentum. The gain of 379 thousand easily beat the forecast of 197 thousand, and was the highest reading since October 2020.

“Rising U.S. bond yields are obviously driving the dollar but what’s behind them is the realisation that U.S. vaccination programme is going ahead very fast and the U.S. economic normalisation may happen earlier than people have expected, perhaps by a quarter or two,” said an senior strategist.

On the other hand, According to a recent news, Japan’s economy expanded at a slower-than-initially-reported pace in October-December, with firms tightening spending on plant and equipment and sharply cutting inventories as the coronavirus pandemic hit demand. The slower growth was mainly due to a sharper contraction in private inventories and capital expenditure expanding less than previously thought in the fourth quarter, even as exports remained solid.

Separate data showed household spending was hit by a bigger annual drop in January than in the prior month, a sign the COVID-19 pandemic was keeping consumers cautious about shopping. The economy grew an annualised 11.7% in October-December, weaker than the preliminary reading of 12.7% annualised growth to mark the second straight quarter of growth.

USD/JPY 4 Hour chart:

Support: 108.44 (S1), 108.02 (S2), 107.77 (S3).

Resistance: 109.11 (R1), 109.36 (R2), 109.79 (R3).

US dollar seems to be stronger against the Japanese yen as per all the factors. We expect a bullish trend for USD/JPY.