GBP/USD Weekly Forecast (08th March 2021 – 12th March 2021)

Fundamental view:

The British pound rallied against the greenback in the previous week but then pulled back to reach a level of 1.3750 level. Dollar was supported with the Higher yields, with every move in US ten-year yields rocking the greenback. The world’s reserve currency advanced each time the global benchmark jumped above 1.5% and retreated when it hovered closer to 1.4%. Investors were closely following the Fed, data, and stimulus developments.

Britain BoE Consumer Credit monthly report and  BoE M4 Money Supply monthly report on 1st March and Britain Markit/CIPS Services PMI on 3rd March created downtrend for the pair whereas US Nationwide HPI monthly report on 2nd March and Britain Markit/CIPS Construction on 4th March favored uptrend for the pair.

The major economic events deciding the movement of the pair in the next week are BoE Governor Bailey Speech at Mar 08, US CPI monthly report, EIA Crude Oil Stocks Change at Mar 10, US JOLTS Job Openings, Initial Jobless Claims at Mar 11, UK Manufacturing Production monthly report, UK GDP monthly report and US Michigan Consumer Sentiment at Mar 12.

 GBP/USD Weekly outlook:

Technical View:

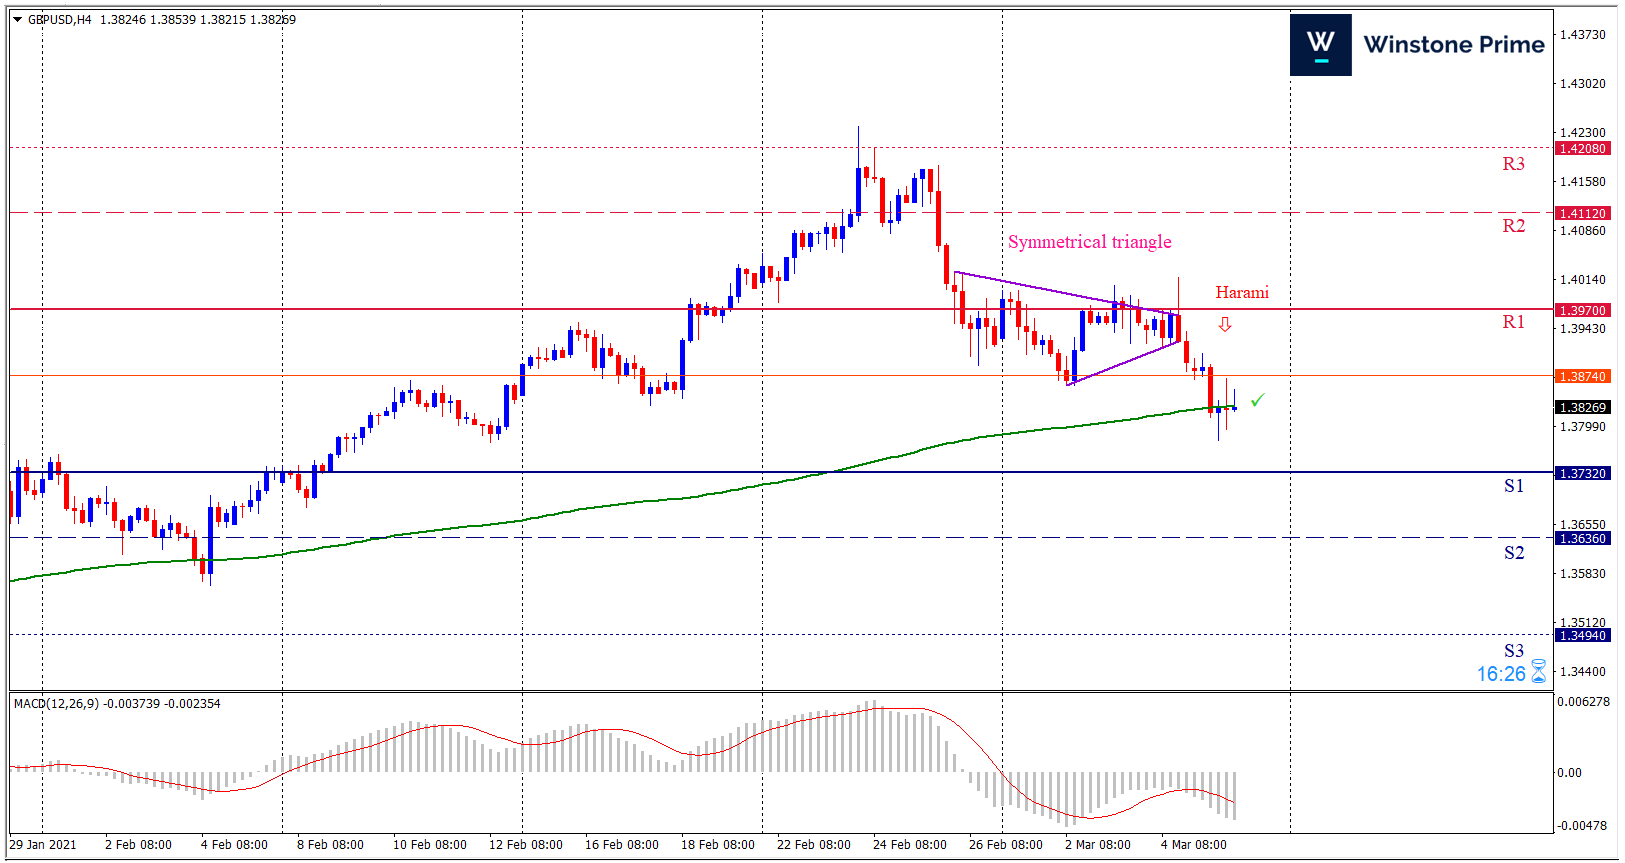
Last week’s high was 1.57% lower than the previous week. Maintaining high at 1.4017 and low at 1.3779 showed a movement of 238 pips.

In the upcoming week we expect GBP/USD to show a bearish trend.  The currency pair is trading below the 200 Simple Moving Average and the MACD trades to the downside. A solid breakout below 1.3732 may open a clean path towards 1.3636 and may take a way down to 1.3494. Should 1.3970 prove to be unreliable resistance, the GBPUSD may raise upwards 1.4112 and 1.4208 respectively. Chart formation of symmetrical triangle pattern breakout downside in H4 chart favors prospects of a bearish trend. Harami pattern formation escalates the expectation for a bearish trend.

Preference
Sell: 1.3836 target at 1.3637 and stop loss at 1.3975


Alternate Scenario
Buy: 1.3975 target at 1.4207 and stop loss at 1.3836

XAU/USD Weekly Forecast (08th March 2021 – 12th March 2021)

Fundamental view:

Gold markets initially tried to rally during the initial of the week but later fell to form a bearish candle. Gold is pressured in part by some upbeat U.S. economic data. Gold prices hit a nine-month low this week. Rising government bond yields this week and a higher U.S. dollar index are also market drivers which support the greenback.

The upbeat data provided an additional boost to the already stronger US dollar and prompted some selling around the dollar-denominated commodity. The USD was further supported by a fresh leg up in the US Treasury bond yields, which tends to drive flows away from the non-yielding yellow metal.

XAU/USD remains on track to record the third consecutive week of losses and vulnerable to slide further. Hence, any attempted recovery might still be seen as a selling opportunity amid the progress on US President Joe Biden’s $1.9 trillion stimulus package.              

The major economic events deciding the movement of the pair in the next week are WASDE Report at Mar 09, CPI monthly report, EIA Crude Oil Stocks Change at Mar 10, JOLTS Job Openings, Initial Jobless Claims at Mar 11, and Michigan Consumer Sentiment at Mar 12 for US.

XAU/USD Weekly outlook:

Technical View:

Last week’s high was 3.10% lower than the previous week. Maintaining high at 1759.8 and low at 1687.2 showed a movement of 726 pips.

In the upcoming week we expect XAU/USD to show a bullish trend.  The Instrument is trading below the 200 Simple Moving Average and the MACD trades to the upside. A solid breakout above 1744.3 may open a clean path towards 1788.4 and may take a way up to 1816.9. Should 1671.7 prove to be unreliable support, the XAUUSD may sink downwards 1643.1 and 1599.0 respectively. In H4 chart deep crab pattern favors prospects of a bullish trend. Also to be noted Bullish engulfing formation exerts the expectation of uptrend for the pair.

Preference
Buy: 1694.3 target at 1787.4 and stop loss at 1666.6


Alternate Scenario
Sell: 1666.6 target at 1600.3 and stop loss at 1694.3

BTC/USD Weekly Forecast (08th March 2021 – 12th March 2021)

Fundamental view:

Bitcoin price has bounced against the greenback and formed a bull candle.  The past week has been quite volatile for the flagship cryptocurrency experiencing moves of up to 10%. In the past week, Microstrategy made several more investments in Bitcoin. The first happened on March 1 right after Bitcoin price touched the local bottom of $43,000. Microstrategy announced the purchase of around 328 Bitcoins for $15 million.

However, the company announced yet another purchase of $10 million worth of Bitcoin and stated that it holds more than 91,000 BTC in total, acquired for about $2.2 billion. Clearly, Bitcoin is receiving unprecedented interest from institutional investors. Arcane Research, a subsidiary of the Norwegian investment company Arcane Crypto has recently released a report on Bitcoin stating that the digital asset could serve as collateral in a trillion-dollar market.

Despite the massive 500% rally in the past year, British asset manager Ruffer believes Bitcoin will rise higher in the near future. Ruffer manages around $28 billion of investor money. Ruffer invested 3% of its assets into Bitcoin last year.

The major economic events deciding the movement of the pair in the next week are WASDE Report at Mar 09, CPI monthly report, EIA Crude Oil Stocks Change at Mar 10, JOLTS Job Openings, Initial Jobless Claims at Mar 11, and Michigan Consumer Sentiment at Mar 12 for US.

BTC/USD Weekly outlook:

Technical View:

Last week’s high was 9.50% lower than the previous week. Maintaining high at 52580.8 and low at 44796.1 showed a movement of 7784 pips.

In the upcoming week we expect BTC/USD to show a bullish trend. The Instrument is trading above the 200 Simple Moving Average and the MACD trades to the downside. A solid breakout above 52484.0 may open a clean path towards 56438.3 and may take a way up to 60295.7. Should 44672.2 prove to be unreliable support, the BTCUSD may sink downwards 40814.8 and 36860.5 respectively. In H4 chart Inverse head and shoulders pattern formation favors prospects of a bullish trend. Bullish engulfing pattern constructs a bullish outlook for the pair in the upcoming week.

Preference
Buy: 47988.1 target at 56432.3 and stop loss at 44668.4


Alternate Scenario
Sell: 44668.4 target at 36861.5 and stop loss at 47988.1

AUD/USD Weekly Forecast (08th March 2021 – 12th March 2021)

Fundamental view:

The Australian dollar has gone back and forth during the course of the week to show signs of exhaustion in the previous week. The slump was all about demand for the American currency amid renewed strength in government bond yields. On Tuesday of the previous week, the Reserve Bank of Australia had a monetary policy meeting. The central bank left the cash rate unchanged at a record low of 0.10%, as widely anticipated. The QE program was also maintained on hold.

Australia Commonwealth Bank Manufacturing PMI & Home Loans on 1st March and Australia Current Account on 2nd March favors bullish trend whereas Australia Commonwealth Bank Services PMI & GDP quarterly report on 3rd March and US Labor Productivity quarterly report on 4th March favored bearish trend for the pair.

The major economic events deciding the movement of the pair in the next week are RBA Governor Lowe Speech, NAB Business Confidence at Mar 09, US CPI monthly report, EIA Crude Oil Stocks Change at Mar 10, US JOLTS Job Openings, Initial Jobless Claims at Mar 11, and US Michigan Consumer Sentiment at Mar 12.

AUD/USD Weekly outlook:

Technical View:

Last week’s high was 2.15% lower than the previous week. Maintaining high at 0.7838 and low at 0.7622 showed a movement of 216 pips.

In the upcoming week we expect AUD/USD to show a bearish trend.  The currency pair is trading below the 200 Simple Moving Average and the MACD trades to the downside. A solid breakout below 0.7591 may open a clean path towards 0.7499 and may take a way down to 0.7375. Should 0.7807 prove to be unreliable resistance, the AUDUSD may raise upwards 0.7931 and 0.8023 respectively. In H4 chart ascending triangle breakout downside favors prospects of a bearish trend. Also to be noted bearish engulfing formation exerts the expectation of downtrend for the pair.

Preference
Sell: 0.7681 target at 0.7500 and stop loss at 0.7812


Alternate Scenario
Buy: 0.7812 target at 0.8021 and stop loss at 0.7681