BTC/USD Weekly Forecast (01st March 2021 – 05th March 2021)

Fundamental view:

Bitcoin fell against greenback in the past week. Bitcoin is trading more than $10,000 per coin less than the current high, after according to one crypto analyst, the “bid” side of market has disappeared, exposing the cryptocurrency’s current weakness.

The lack of buying currently could be due to what another analyst calls a jittering macro environment, referencing the stock and bond markets that have seen volatility as of late.  Here’s what else is going on in both traditional and crypto markets that could have investors waiting to pull the trigger currently.

The major economic events deciding the movement of the pair in the next week are ISM Manufacturing PMI at Mar 01, Fed Governor Brainard Speech at Mar 02, ADP Nonfarm Employment Change, ISM Non-Manufacturing PMI at Mar 03, Initial Jobless Claims, Fed Chair Powell Speech at Mar 04, and Nonfarm Payrolls at Mar 05 for US.

BTC/USD Weekly outlook:

Technical View:

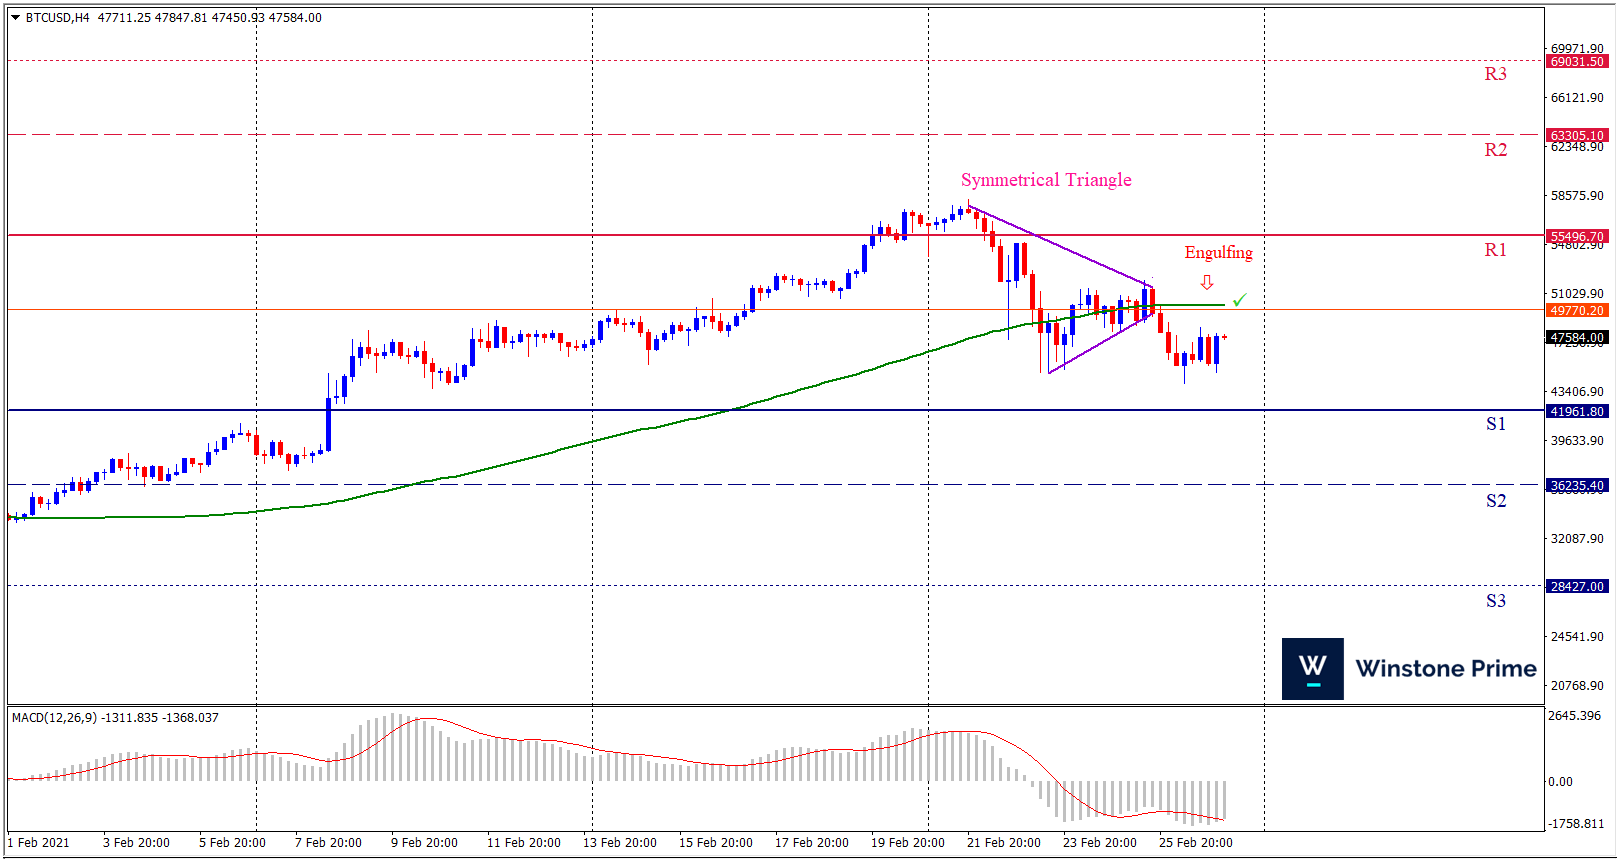
Last week’s high was 1.26% lower than the previous week. Maintaining high at 57578.6 and low at 44043.7 showed a movement of 13535 pips.

In the upcoming week we expect BTC/USD to show a bearish trend. The Instrument is trading below the 100 Simple Moving Average and the MACD trades to the downside. A solid breakout below 41961.8 may open a clean path towards 36235.4 and may take a way down to 28427.0. Should 55496.7 prove to be unreliable resistance, the BTCUSD may raise upwards 63305.1 and 69031.5 respectively. In H4 chart symmetrical Triangle breakout favors prospects of a bearish trend. Bearish engulfing pattern constructs a bearish outlook for the pair in the upcoming week.

Preference
Sell: 47666.7 target at 36236.4 and stop loss at 55500.3


Alternate Scenario
Buy: 55500.3 target at 69030.2 and stop loss at 47666.7

USD/JPY Weekly Forecast (01st March 2021 – 05th March 2021)

Fundamental view:

The US dollar initially pulled back during the starting and then rallied against the yen at the end of the week. The sharp rise in real interest rates in the US (yield -inflation) has been the largest factor in the ascent of the USD/JPY this year. Even though the dollar overall has had a nondescript two months, the Dollar Index is up a paltry 0.7% since December 31, the USD/JPY has gained 3.1% since the beginning of the year. There has been no indication from the US Federal Reserve that it is concerned about the increase in medium to long-term yields, even as Chairman Jerome Powell promises to keep rates low until the recovery is complete.

The major economic events deciding the movement of the pair in the next week are US HPI y/y , S&P/CS HPI Composite-20 n.s.a. monthly report on 23rd Feb and US EIA Crude Oil Stocks Change & US EIA Heating Oil Stocks Change on 24 th Feb created bearish trend whereas US Chicago Fed National Activity Index on 22nd Feb and Japan BoJ Trimmed Mean Core CPI y/y & Japan BoJ Weighted Median Core CPI yearly report on 24th Feb created bullish trend for the pair.

USD/JPY Weekly outlook:

 Technical View:

Last week’s high was 0.44% higher than the previous week. Maintaining high at 106.69 and low at 104.92 showed a movement of 177 pips.

In the upcoming week we expect USD/JPY to show a bullish trend. The currency pair is trading above the 200 Simple Moving Average and the MACD trades to the upside. A solid breakout above 107.16 may open a clean path towards 107.81 and may take a way up to 108.93. Should 105.39 prove to be unreliable support, the USDJPY may sink downwards 104.27 and 103.62 respectively. In H4 chart, Formation of extended W pattern indicates prospects of a bullish trend Along with a bullish engulfing formation brace our expectation.

Preference
Buy: 106.45 target at 107.80 and stop loss at 105.34


Alternate Scenario
Sell: 105.34 target at 103.63 and stop loss at 106.45

AUD/USD Weekly Forecast (01st March 2021 – 05th March 2021)

Fundamental view:

The AUD/USD pair was in uptrend in the beginning of the week touching a fresh three-year high, but it was all downtrend from there. Wall Street plummeted as US Treasury yields soared to one-year highs, by dragging commodity-linked currencies lower. The pair made a rally as the American dollar maintained its sour tone while investors remained mostly optimistic about future economic developments. Meanwhile, US Treasury yields stormed higher but accelerated their advances after US Federal Reserve chief Jerome Powell testified on monetary policy before Congress.

US S&P/CS HPI Composite-20 n.s.a. m/m & US S&P/CS HPI Composite-20 s.a. on 23rd Feb and US EIA Crude Oil Stocks Change & US EIA Cushing Crude Oil Stocks Change on 24th Feb favored uptrend for the pair whereas US Chicago Fed National Activity Index & US Dallas Fed Manufacturing Index on 22nd Feb and Australia Construction Work Done on 24th Feb created downtrend for the pair.

The major economic events deciding the movement of the pair in the next week are US ISM Manufacturing PMI at Mar 01, RBA Interest Rate Decision at Mar 02, Australia GDP quarterly report, US ADP Nonfarm Employment Change, US ISM Non-Manufacturing PMI at Mar 03, Fed Chair Powell Speech at Mar 04, and US Nonfarm Payrolls at Mar 05.

AUD/USD Weekly outlook:

Technical View:

Last week’s high was 1.62% higher than the previous week. Maintaining high at 0.8007 and low at 0.7692 showed a movement of 315 pips.

In the upcoming week we expect AUD/USD to show a bearish trend.  The currency pair is trading below the 200 Simple Moving Average and the MACD trades to the downside. A solid breakout below 0.7591 may open a clean path towards 0.7484 and may take a way down to 0.7276. Should 0.7906 prove to be unreliable resistance, the AUDUSD may raise upwards 0.8114 and 0.8221 respectively. In H4 chart expanding triangle breakout favors prospects of a bearish trend. Also to be noted three inside down pattern formation exerts the expectation of downtrend for the pair.

Preference
Sell: 0.7704 target at 0.7485 and stop loss at 0.7911


Alternate Scenario
Buy:  0.7911 target at 0.8219 and stop loss at 0.7704

XAU/USD Weekly Forecast (01st March 2021 – 05th March 2021)

Fundamental view:

Gold fell to an eight-month low on Friday this week to its worst month since November 2016 as a stronger dollar and elevated U.S. Treasury yields hammered non-yielding bullion’s appeal. “Rising 10-year yields, along with the U.S. dollar moving higher, and we had a resurgence in risk appetite. All that was a very bad recipe for gold,” said an strategist.

The downfall was exclusively sponsored by a strong bid tone surrounding the US dollar, which tends to drive flows away from the dollar-denominated commodity. The USD added to the previous day’s solid gains led by a sharp rise in the US Treasury bond yields. The US bond market has been reacting to the prospects for a strong global economic recovery amid the progress in COVID-19 vaccinations and US President Joe Biden’s proposed $1.9 trillion pandemic relief package.              

The major economic events deciding the movement of the pair in the next week are ISM Manufacturing PMI at Mar 01, Fed Governor Brainard Speech at Mar 02, ADP Nonfarm Employment Change, ISM Non-Manufacturing PMI at Mar 03, Initial Jobless Claims, Fed Chair Powell Speech at Mar 04, and Nonfarm Payrolls at Mar 05 for US.

XAU/USD Weekly outlook:

Technical View:

Last week’s high was 0.61% lower than the previous week. Maintaining high at 1816.0 and low at 1717.3 showed a movement of 988 pips.

In the upcoming week we expect XAU/USD to show a bearish trend.  The Instrument is trading below the 200 Simple Moving Average and the MACD trades to the downside. A solid breakout below 1696.1 may open a clean path towards 1657.3 and may take a way down to 1597.4. Should 1794.9 prove to be unreliable resistance, the XAUUSD may raise upwards 1854.9 and 1893.7 respectively. In H4 chart Ascending Triangle breakout downside favors prospects of a bearish trend. Also to be noted bearish engulfing formation exerts the expectation of downtrend for the pair.

Preference
Sell: 1735.9 target at 1658.3 and stop loss at 1799.4


Alternate Scenario
Buy: 1799.4 target at 1892.7 and stop loss at 1735.9