Firmer yield weighs on the bullion

  • Gold prices dropped due to firmer U.S. Treasury yields and improved risk appetite on hopes of peace between Russia and Ukraine.
  • Pessimism surrounding China’s coronavirus conditions weighs on the gold prices.
  • Indian gold dealers were forced to offer the steepest discount in six years last week.


The yellow metal prices stays pressured on Monday due to rise of U.S. Treasury yields on rate hike expectations, with higher risk appetite on hopes of peace between Russia and Ukraine which dents on bullion’s safe-haven appeal further.

The brighter progress on the Ukraine-Russia peace talks improved the market sentiment weighing on the yellow metal. Russian President Vladimir Putin said last week there had been some progress in Moscow’s talks with Ukraine, but provided no details.

However, Chatters surrounding Russian prosecutors’ warnings to the West and Pentagon’s press secretary John Kirby’s comments suggesting Russian forces are “broadening their target sets” keep the XAU/USD buyers hopeful.

Further weighing on the gold prices could be the firmer US Treasury yields and pessimism surrounding China’s coronavirus conditions.

That said China is one of the world’s largest gold consumers and the fresh fears of covid, due to the highest daily infections in two years, negatively affects the gold prices.

Meanwhile, physical gold dealers in India were forced to offer the steepest discount in six years last week to lure customers put off by a jump in domestic prices, with some people in top Asian hubs selling their bullion to cash in on the rally.

Elsewhere, the cues from the US Consumer Price Index (CPI) dictate a 50 basis point (bps) interest rate decision from the Fed on a print of 7.9%.

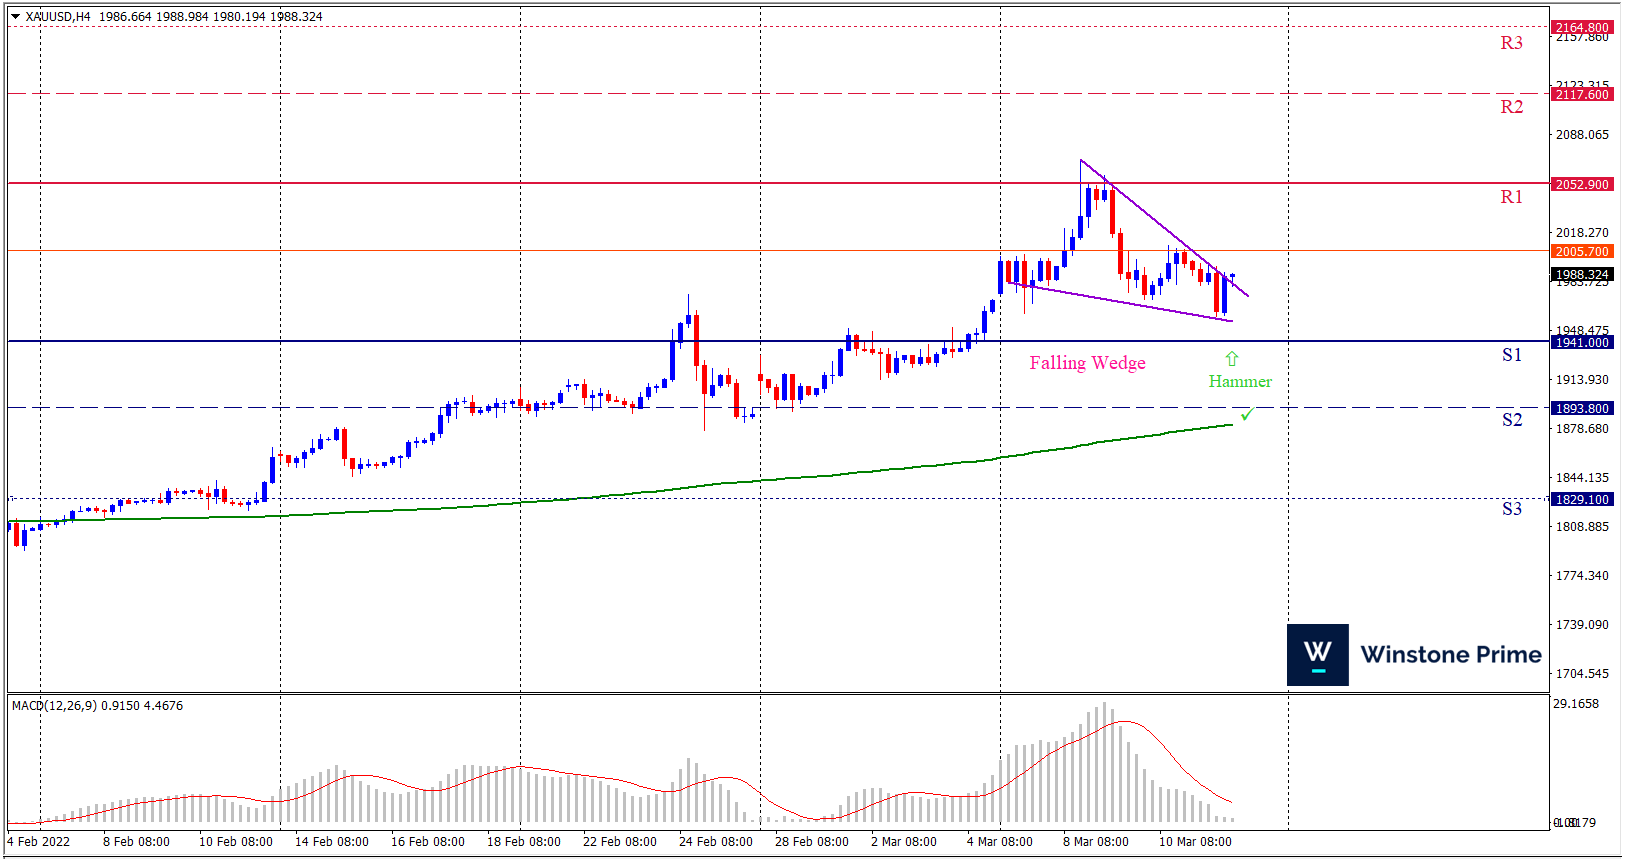
XAU/USD 4 Hour Chart:

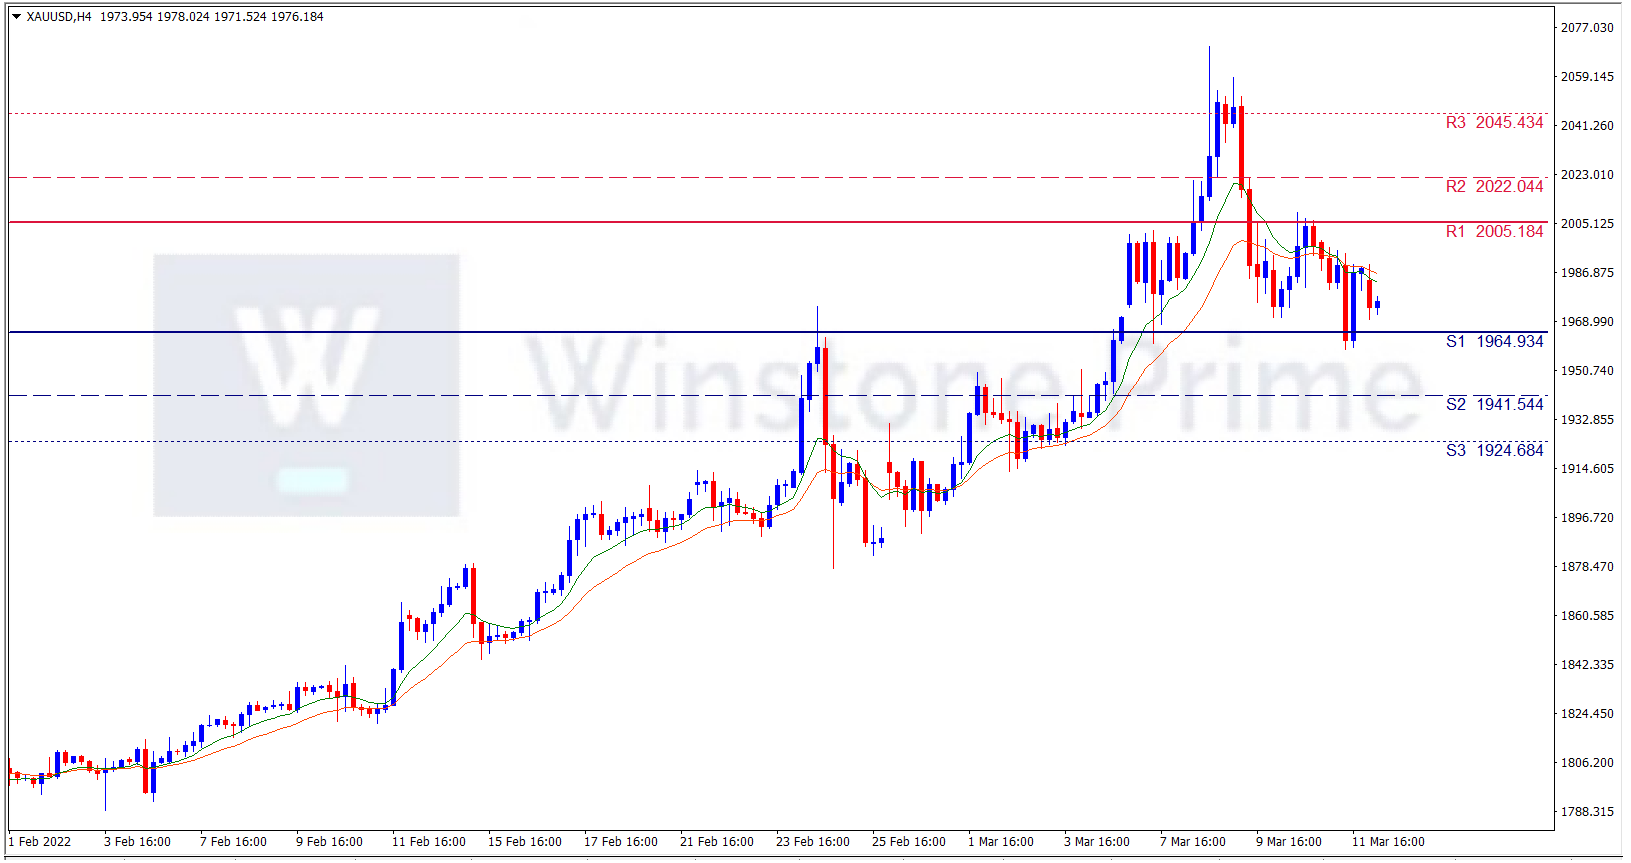
Support: 1964.9 (S1), 1941.5 (S2), 1924.7 (S3).

Resistance: 2005.2 (R1), 2022.0 (R2), 2045.4 (R3).

The Fed, Headlines of Russia – Ukraine jitters are the key factors which will direct the XAU/USD further. In the meantime, we expect a bearish trend for XAU/USD.

BTC/USD Weekly Forecast (14th March 2022 – 18th March 2022)

Fundamental view:

Bitcoin traded high and erased some of its previous week’s losses against the greenback during this week. Financial Market was largely impacted with the Russia- Ukraine tension this week. President Joe Biden’s new executive order on cryptocurrency that was announced Wednesday saw Bitcoin’s price increase by 10%, before falling back. The order directed government agencies to coordinate on a strategy to regulate cryptocurrency, and experts say it could bring more stability to the crypto market in the long-term. Experts say Bitcoin has also seen extra volatility as a result of Russia’s invasion of Ukraine. With no end in sight, the war in Ukraine will likely continue to drive more volatility in the coming days.

Although volatility and recent slumping price impacts Bitcoin, many experts still say Bitcoin is on its way to passing the $100,000 mark, with varying opinions on exactly when that will happen. And a recent study by Deutsche Bank found that about a quarter of Bitcoin investors believe Bitcoin prices will be over $110,000 in five years.

The major economic events deciding the movement of the pair in the next week are NY Fed Empire State Manufacturing Index at Mar 15, Retail Sales monthly report, EIA Crude Oil Stocks Change, Fed Interest Rate Decision at Mar 16, Initial Jobless Claims, Fed Industrial Production yearly report at Mar 17, Fed Governor Bowman Speech at Mar 18 for US.

BTC/USD Weekly outlook:

Technical View:

Last week’s high was 6.02% lower than the previous week. Maintaining high at 42566.3 and low at 37165.2 showed a movement of 5401 pips.

In the upcoming week we expect BTC/USD to show a bearish trend. The Instrument is trading below the 200 Simple Moving Average and the MACD trades to the downside. Should 36628.4 proves to be unreliable support then the pair may fall further to 34196.2 and 31227.3 respectively whereas a solid breakout above 42029.5 will open a clear path upward to 44998.4 and then will further raise up to 47430.6. In H4 chart bearish shark pattern favors prospects of a bearish trend. Shooting star pattern constructs a bearish outlook for the pair in the upcoming week.

Preference
Sell: 38876.7 target at 34197.4 and stop loss at 42034.5


Alternate Scenario
Buy: 42034.5 target at 47429.6 and stop loss at 38876.7

XAU/USD Weekly Forecast (14th March 2022 – 18th March 2022)

Fundamental view:

The yellow metal climbed high against the US dollar during the trading course of the week. Market sentiment remained sour for most of the week, which helped the safe-haven flows and it reached to its highest level above $2,070 on Tuesday. However after Thursday’s meeting between the foreign ministers of Russia and Ukraine, market sentiment improved and positive sentiment dominated on Friday Thursday’s meeting between the foreign ministers of Russia and Ukraine which heavily weighed on the gold.

Moving on to Central bank, The US Federal Reserve is largely expected to kick off its tightening cycle with a 25 basis points rate hike when the two-day FOMC policy meeting concludes on Wednesday, March 16. However, uncertainty on the economic outlook and inflation has increased by the Russia-Ukraine war, the Fed is unlikely to surprise the markets with a double-dose rate increase.              

The major economic events deciding the movement of the pair in the next week are NY Fed Empire State Manufacturing Index at Mar 15, Retail Sales monthly report, EIA Crude Oil Stocks Change, Fed Interest Rate Decision at Mar 16, Initial Jobless Claims, Fed Industrial Production yearly report at Mar 17, Fed Governor Bowman Speech at Mar 18 for US.

XAU/USD Weekly outlook:

Technical View:

Last week’s high was 5.05% higher than the previous week. Maintaining high at 2070.3 and low at 1958.4 showed a movement of 1119 pips.

In the upcoming week we expect XAU/USD to show a bullish trend. The Instrument is trading above the 200 Simple Moving Average and the MACD trades to the upside. A solid breakout above 2052.9 may open a clean path towards 2117.6 and may take a way up to 2164.8. Should 1941.0 prove to be unreliable support, the XAUUSD may sink downwards 1893.8 and 1829.1 respectively. In H4 chart falling wedge pattern breakout favors prospects of a bullish trend. Also to be noted hammer formation exerts the expectation of uptrend for the pair.

Preference
Buy: 1989.3 target at 2051.9 and stop loss at 1935.7


Alternate Scenario
Sell: 1935.7 target at 1876.5 and stop loss at 1989.3

AUD/USD Weekly Forecast (14th March 2022 – 18th March 2022)

Fundamental view:

Australian dollar dropped against the American dollar during the trading course of the week However, the commodity-linked currency AUD managed to reach its 2022 high of 0.7440 against its American rival before dropping.  Headlines relating to Russian invasion of Ukraine dominated the where the situation worsened on a daily basis. However Market sentiment improved at the weekend on Friday with Russian President Vladimir Putin’s comment that there were “certain positive developments” in talks with Ukraine.

The Fed has promised a 0.25% hike on March 16. Treasury futures have the odds at 95.9%. Markets are undecided whether the governors will initiate a reduction of the bank’s $9 trillion balance sheet. On contrary, Reserve Bank of Australia insists on its wait-and-see stance.

In this week, NAB Business Confidence on 8th March and US Initial Jobless Claims on 10th March helped bullish trend whereas US JOLTS Job Openings on 9th March and US CPI monthly report on 10th March helped bearish trend for the pair.

The major economic events deciding the movement of the pair in the next week are RBA Meeting Minutes, NY Fed Empire State Manufacturing Index at Mar 15, US Retail Sales monthly report, Fed Interest Rate Decision at Mar 16, Australia Employment Change, Initial Jobless Claims, US Fed Industrial Production yearly report at Mar 17 and Fed Governor Bowman Speech at Mar 18.

AUD/USD Weekly outlook:

Technical View:

Last week’s high was 0.81% higher than the previous week. Maintaining high at 0.7440 and low at 0.7245 showed a movement of 195 pips.

In the upcoming week we expect AUD/USD to show a bearish trend. The currency pair is trading below the 50 Simple Moving Average and the MACD trades to the downside. Should 0.7207 proves to be unreliable support then the pair may fall further to 0.7128 and 0.7012 respectively whereas a solid breakout above 0.7402 will open a clear path upward to 0.7518 and then will further raise up to 0.7597. In H4 chart bearish gartley pattern formation favors prospects of a bearish trend. Also to be noted bearish engulfing formation exerts the expectation of downtrend for the pair.

Preference
Sell: 0.7284 target at 0.7095 and stop loss at 0.7407


Alternate Scenario
Buy: 0.7407 target at 0.7596 and stop loss at 0.7284