Daily Chart Trading Strategy

The daily chart trading strategy is a simple trading strategy that even beginner traders will find so easy to use. It works better for daily chart. If you think that trading the daily chart fits you than intraday trading, then give a try to this trading strategy.

Timeframes : Daily

Instrument : You can use it for any instrument

Indicators : Stochastic indicator required with default setting (5,3,3)

Fibonacci tool: Retracement tool

Reasons for daily chart trading system having advantages than trading in much smaller timeframes:

  • Traders are less frequent which means you will not over trade
  • Market noise is less involved in the daily timeframe compared to the 4 hr, 1hr or the 30 min and much lower timeframes.
  • The trading signals tend to be more reliable.
  • It has much bigger profit potential.


To be noted is that the stop loss would tend to have a large distance as it is based off the daily chart.

Then it means the risk is higher?

Risk should be set with consideration of the percentage of trading capital. We have many variations of lot sizes we can trade so while the protective stop in pips may be large, it can still be a small percentage of risk capital.

Working of this strategy :

We all know that a market will trend and then will consolidate. It will happen again and again. An uptrend will eventually turn into a downtrend and the opposite is also true.

We will get corrective moves in between a full blown trend change and that is what this simple daily chart trading strategy wants to capitalize on. We need to see price meet up with one of our Fibonacci level and confirm with our stochastic oscillator.

Let us explain with a chart below:

Trading Rules:

The rules are very simple to follow. Just look at the trading instructions listed below and do the same.

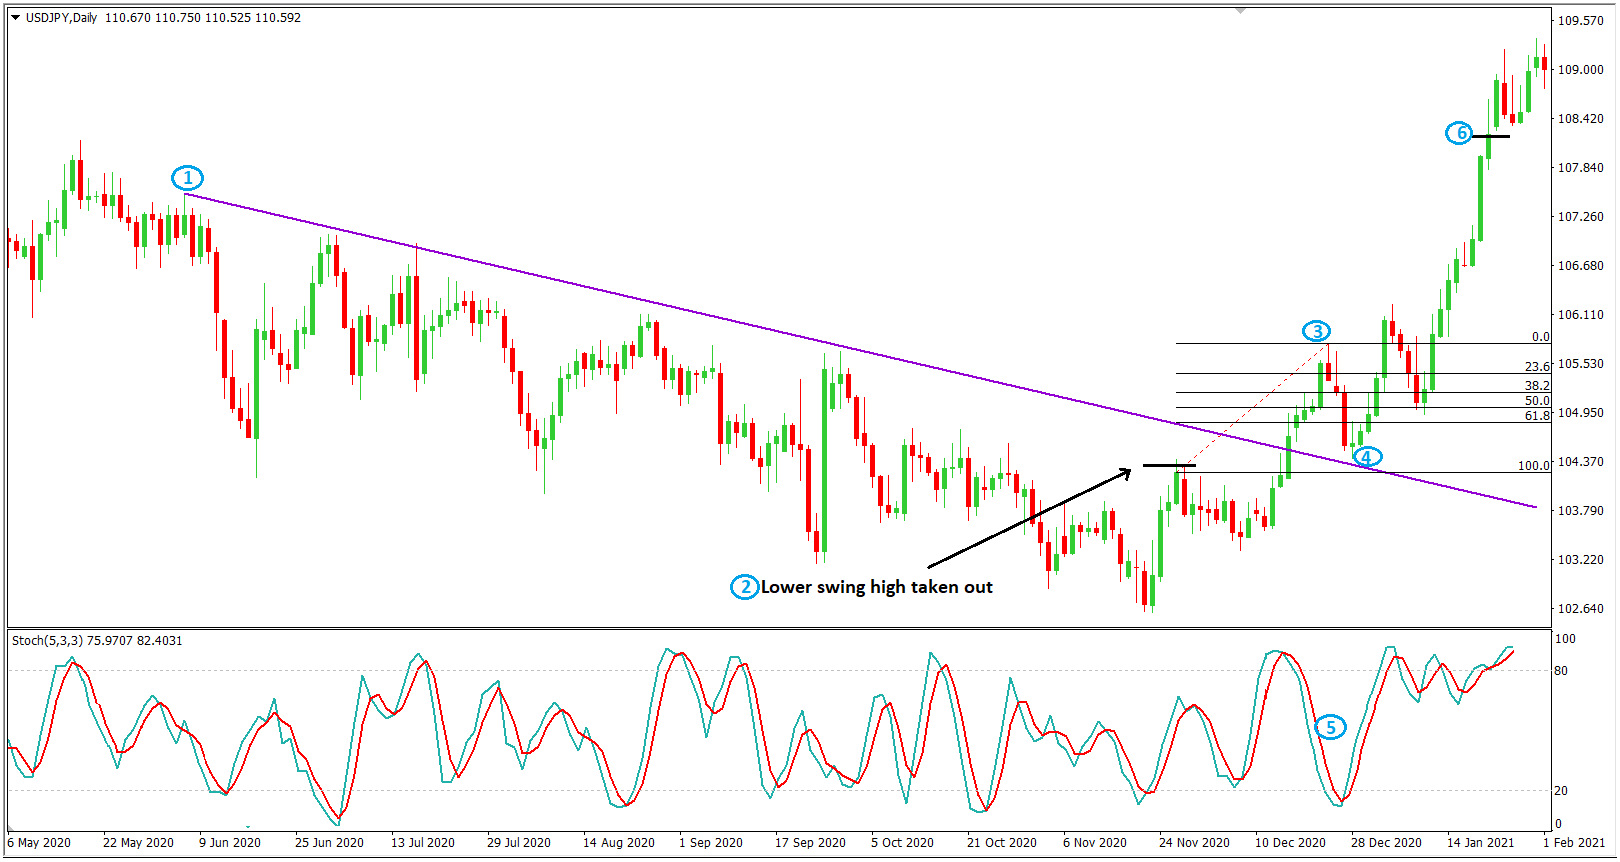
  • The pair must be in an ongoing downtrend and we have made use of an objective trend measure a – break of a trend line.
  • After seeing a price takes out a previous high which is the beginning of the stage for an uptrend.
  • After a high is in place, we can then draw our Fibonacci retracement levels.
  • Then after price pulls back to the 61.8% retracement level and puts in a price action reversal candlestick.
  • Stochastic was in an oversold zone so this is a valid trade and we can place a buy stop trading order at the high of the reversal.
  • Set take profit at a main swing high in the opposing market trend.


Pros :

  • This strategy has the potential to give you over 100 pips a day as it is a larger time frame trading system.
  • No need to worry on the random fluctuations in price or news releases that will affect day traders.
  • Easy to understand and follow.


Cons :

  • This cannot be followed in non trending market.
  • This will not appeal to traders who want constant trading action.
  • Stop loss might be high in a range of 50 – 100 pips.

Hopes of recovering from coronavirus favors pound

Cable is traded with the positive momentum. The bulls attack the highest levels since April 2018, flashed the previous day, ahead of the UK employment report for January. The forecasts suggest improvement in the UK jobs report but any disappointment can’t be ignored as this includes the lockdown period.

Interest rates may stay at historically low levels for decades, the Bank of England (BOE) policymaker Gertjan Vlieghe said in a webinar on Monday, adding that he doesn’t see higher rates returning in his lifetime. Vlieghe who is 49, also said longer life expectancies and more time spent in retirement had boosted demand for safe retirement assets, pushing down long-run interest rates across developed economies including Britain.

When asked by students at Durham University when interest rates might return to the level of 4% to 5% common before the financial crisis, Vlieghe replied: “Maybe not in my lifetime.” “Actually if you look at very long run data on interest rates, it’s the 1970s and 1980s that were unusual decades. Interest rates were unusually high then,” he added.

Bank of England officials have talked before of the long-run downward pressure on interest rates, but rarely look as far forward into the future as Vlieghe did.

On the other hand, The U.S. dollar resumed its slide on Monday and reached multi-year lows against the British pound as the traders is focused on the promise of coronavirus vaccinations and the outlooks for economic growth and inflation.

The dollar’s downtrend has come as the benchmark yield on 10-year Treasury notes has climbed to 1.37% from 1.1% at end of January. This 10-year yield is relatively steady in trading on Monday in advance of Powell’s testimony, which will go into a second day on Wednesday before another committee.

“The dollar continues to wax and wane with U.S. data that have painted a mixed picture of the world’s biggest economy,” said an Analyst. Weakness in U.S. employment has been undermining dollar rallies as markets see wavering jobs data reinforcing the Federal Reserve’s commitment to low interest rates, Analyst added.

GBP/USD 4 Hour Chart:

Support: 1.4000 (S1), 1.3938 (S2), 1.3894 (S3).

Resistance: 1.4106 (R1), 1.4149 (R2), 1.4211 (R3).

Amid reflation trade and economy re-opening up from the coronavirus pandemic induced lockdowns, the pound remains the top performer; we expect a bullish trend for GBP/USD.

Josh Frydenberg’s tweet supports Aussie

Australia is one of the nine nations which holds a AAA credit rating, the country’s Treasurer Josh Frydenberg said after the US-based Fitch Ratings affirmed the OZ economy’s top-tier AAA rating,

Country’s Treasurer Josh Frydenberg tweeted out that “Fitch says we have ‘weathered the pandemic well compared with peers’ and ‘Australia’s labor market appears to be on a stable path to recovery, supported by the JobKeeper program’.”

Elsewhere, Australia’s Shadow treasurer Dr. Jim Chalmers said, “the biggest threat to our recovery is Scott Morrison and Josh Frydenberg prematurely declaring victory.” “(This ignores) the fact that over two million Australians still don’t have work or enough work, wages are stagnant, and our economy had become less dynamic and resilient well before the pandemic,” he added.

On the other hand, China’s State Councillor and Foreign Minister Wang Yi blamed the previous US government for the tensions in the Sino America. and pushed for fresh ties in his latest comments. He cited further areas for cooperation while stimulating the US to interfere in their initial issues and call back the trade-restrictive duties.

UK’s readiness to calm the virus-led lockdown and Israel’s optimism following the victory over the coronavirus (COVID-19) has favored the market sentiment and increased optimism. Also on the positive side are hopes of the US covid relief package.

US dollar index (DXY) marked its second consecutive negative weekly closing for the first time in 2021 despite the jump in the US 10-year Treasury yields, this creates a negative impact on greenback again favoring AUD/USD.

AUD/USD 4 Hour Chart:

Support: 0.7792 (S1), 0.7715 (S2), 0.7672 (S3).

Resistance: 0.7911 (R1), 0.7954 (R2), 0.8031 (R3).

Market optimism is created for Aussie due to multiple factors like Country’s Treasurer Josh Frydenberg speech and Australia’s readiness on virus handling. Hence we expect a bullish trend for AUD/USD.

XAU/USD Weekly Forecast (22nd February 2021 – 26th February 2021)

Fundamental view:

Gold fell against greenback last week as It was hit by a slate of negative news. This week’s primary downward pressure came from rising U.S. Treasury yields mixed in with the stronger U.S. dollar. The sharp upsurge witnessed in the US Treasury bond yields helped the USD stay resilient against its rivals and caused XAU/USD to lost more than 1% on the day. On Wednesday, the upbeat macroeconomic data releases from the US provided an additional boost to the greenback and XAU/USD extended its slide. 

In the past week, The US Census Bureau reported that Retail Sales in January increased by 5.3% and it beat the market expectation for an increase of 1% by a wide margin. Elsewhere, Industrial Production in the same period expanded by 0.9%, compared to analysts’ estimate of 0.5%. Finally, the FOMC’s January meeting minutes showed that policymakers remained cautiously optimistic about the economic outlook.  All these catalysts favored greenback against the yellow metal.

The major economic events deciding the movement of the pair in the next week are Fed Governor Bowman Speech at Feb 22, Fed Chair Powell Testimony, CB Consumer Confidence Index at Feb 23, Fed Chair Powell Testimony, EIA Crude Oil Stocks Change at Feb 24, GDP quarterly report, Core Durable Goods Orders monthly report, and Initial Jobless Claims at Feb 25 for US.

XAU/USD Weekly outlook:

Technical View:

Last week’s high was 1.55% lower than the previous week. Maintaining high at 1827.0 and low at 1760.6 showed a movement of 664 pips.

In the upcoming week we expect XAU/USD to show a bearish trend.  The Instrument is trading below the 200 Simple Moving Average and the MACD trades to the downside. A solid breakout below 1754.2 may open a clean path towards 1724.2 and may take a way down to 1687.8. Should 1820.6 prove to be unreliable resistance, the XAUUSD may raise upwards 1857.0 and 1887.0 respectively. In H4 chart bearish gartley pattern formation favors prospects of a bearish trend. Also to be noted bearish harami formation exerts the expectation of downtrend for the pair.

Preference
Sell: 1785.2 target at 1725.2 and stop loss at 1825.6


Alternate Scenario
Buy: 1825.6 target at 1886.7 and stop loss at 1785.2