BTC/USD Weekly Forecast (22nd February 2021 – 26th February 2021)

Fundamental view:

The price of bitcoin has hit an all-time high again Friday, pushing its market capitalization above $1 trillion. After a 160% increase over the past 3 months, the open interest on Bitcoin (BTC) options reached a new record-high at $12 billion. While this number might seem unusually high, it makes sense that the figure would increase as Bitcoin’s market capitalization surpassed $1 trillion. 

This past week has been extremely beneficial for Bitcoin which jumped by 30% since Monday 8. Several positive announcements, especially Tesla purchasing $1.5 billion worth of the digital asset helped the cryptocurrency to new highs.

The first major payment application that started to support Bitcoin, PayPal, will roll out its crypto business into the UK market, thanks to the Venmo application. The platform plans to roll out the new service later this year, probably in the first half. The good news doesn’t stop there as RBC Capital Markets, a global investment bank, has suggested Apple to support cryptocurrencies on its Wallet app, which would allow the company’s stock to surge by another 25%. 

The major economic events deciding the movement of the pair in the next week are Fed Governor Bowman Speech at Feb 22, Fed Chair Powell Testimony, CB Consumer Confidence Index at Feb 23, Fed Chair Powell Testimony, EIA Crude Oil Stocks Change at Feb 24, GDP quarterly report, Core Durable Goods Orders monthly report, and Initial Jobless Claims at Feb 25 for US.

BTC/USD Weekly outlook:

Technical View:

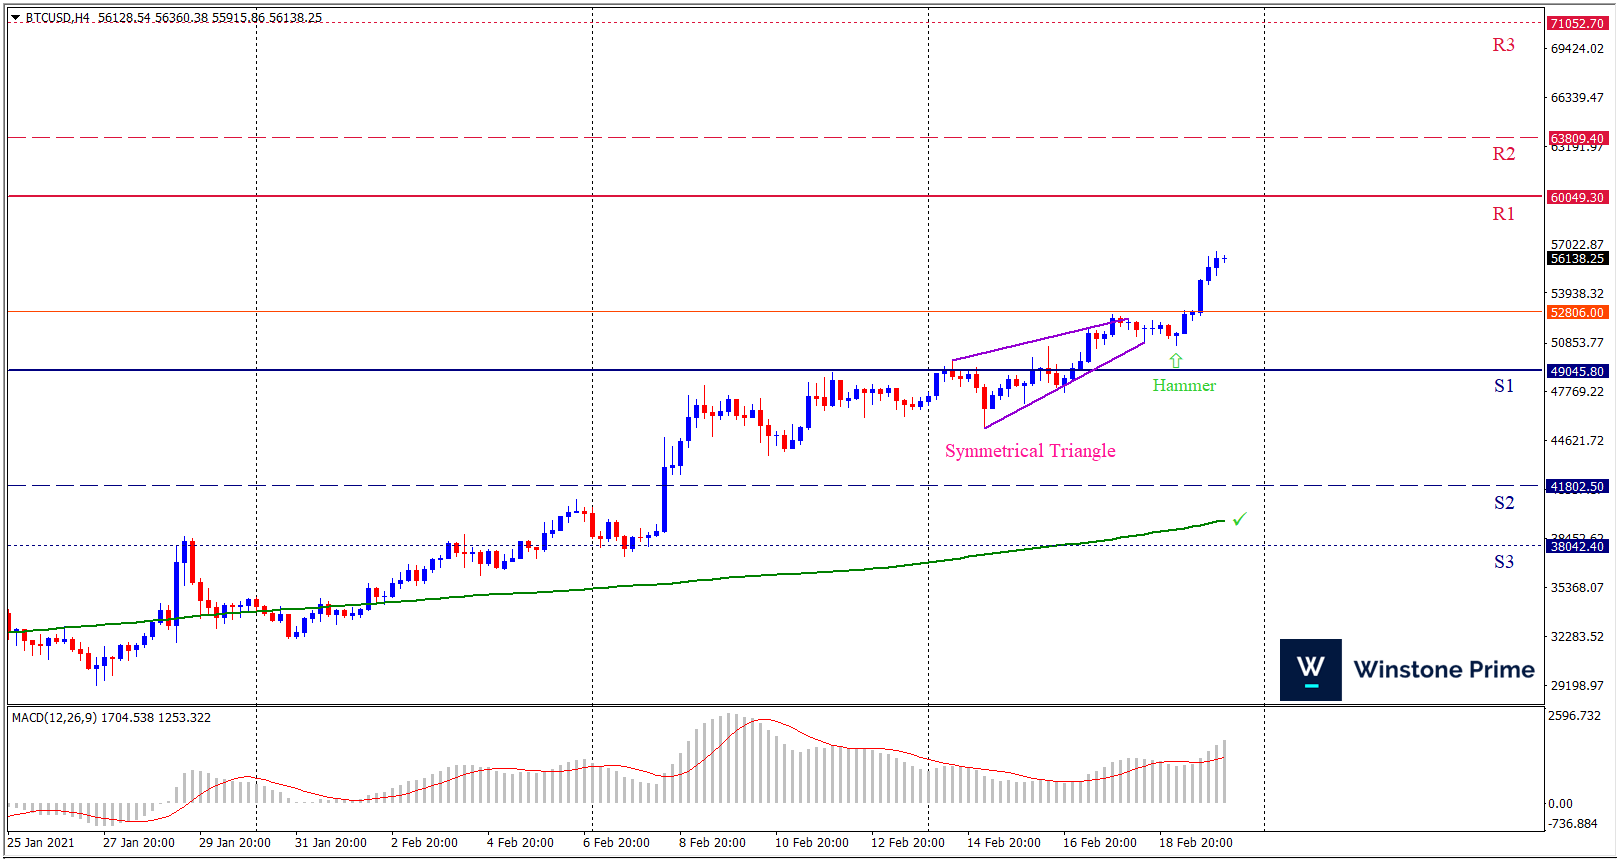
Last week’s high was 12.18% higher than the previous week. Maintaining high at 56566.1 and low at 45562.7 showed a movement of 11004 pips.

In the upcoming week we expect BTC/USD to show a bullish trend. The Instrument is trading above the 200 Simple Moving Average and the MACD trades to the upside. A solid breakout above 60049.3 may open a clean path towards 63809.4 and may take a way up to 71052.7. Should 49045.8 prove to be unreliable support, the BTCUSD may sink downwards 41802.5 and 38042.4 respectively. In H4 chart Symmetrical triangle breakout favors prospects of a bullish trend. Bullish hammer pattern constructs a bullish outlook for the pair in the upcoming week.

Preference
Buy: 55102.7 target at 64808.4 and stop loss at 49040.8


Alternate Scenario
Sell: 49040.8 target at 38043.4 and stop loss at 55102.7

EUR/USD Weekly Forecast (22nd February 2021 – 26th February 2021)

Fundamental view:

The Euro has fallen a bit during the course of the week but then turned around to wake up yet again. The Euro has ended the week where it started, in the 1.2130 price zone, and while it expanded its weekly range. Investor’s attention is centered on US Treasury yields, as long-term ones soared to one-year highs. The dollar was rallying with yields at the starting, but the exceptional correlation was short-lived, fading as the days went by.

Europe Trade Balance on 15th Feb and US Housing Starts monthly report on 18th Feb favored uptrend for the pair whereas US NY Fed Empire State Manufacturing on 16th Feb and US TIC Net Long-Term Transactions on 17th Feb favored downtrend for the pair.

The major economic events deciding the movement of the pair in the next week are Europe Ifo Business Climate at Feb 22, Fed Chair Powell Testimony, US CB Consumer Confidence Index at Feb 23, Fed Chair Powell Testimony at Feb 24, US GDP quarterly report, US Core Durable Goods Orders monthly report, US Initial Jobless Claims at Feb 25, and Europe GDP quarterly report at Feb 26.

EUR/USD Weekly outlook:

Technical View:

Last week’s high was 0.17% higher than the previous week. Maintaining high at 1.2170 and low at 1.2023 showed a movement of 147 pips.

In the upcoming week we expect EUR/USD to show a bullish trend. The currency pair is trading above the 100 Simple Moving Average and the MACD trades to the upside. A solid breakout above 1.2184 may open a clean path towards 1.2250 and may take a way up to 1.2330. Should 1.2038 prove to be unreliable support, the EURUSD may sink downwards 1.1957 and 1.1891 respectively. Chart formation of a bullish shark pattern in H4 chart sets prospects for a bullish trend. Engulfing formation in H4 chart escalates the expectation for a bullish trend.

Preference
Buy: 1.2108 target at 1.2249 and stop loss at 1.2033


Alternate Scenario
Sell:  1.2033 target at 1.1892 and stop loss at 1.2108

AUD/USD Weekly Forecast (22nd February 2021 – 26th February 2021)

Fundamental view:

AUD has rallied against greenback in the past week. The Aussie is continuing to benefit from the outperformance from building optimism over the global growth outlook which is helping to improve Australia’s terms of trade. The RBA noted earlier this week that the trade-weighted Aussie would normally be expected to be around 5% higher based on higher commodity prices, but the upside trend was disturbed  by the RBA’s loose policy stance. Still yields have risen sharply in Australia with the 10-year government bond yield rising back above 1.4% from just below 1.0% at the start of this year.

US NY Fed Empire State Manufacturing Index on 16th Feb and US TIC Net Long-Term Transactions on 17th Feb favors bearish atmosphere for the pair whereas US Housing Starts & US Housing Starts on 18th Feb and Australia Retail Sales on 19th Feb favors bullish trend for the pair.

The major economic events deciding the movement of the pair in the next week are Fed Chair Powell Testimony, US CB Consumer Confidence Index at Feb 23, Australia Wage Price Index quarterly report, Fed Chair Powell Testimony at Feb 24, Australia Private New Capital Expenditure quarterly report, US GDP quarterly report, US Core Durable Goods Orders monthly report, and US Initial Jobless Claims at Feb 25.

AUD/USD Weekly outlook:

Technical View:

Last week’s high was 1.35% higher than the previous week. Maintaining high at 0.7877 and low at 0.7724 showed a movement of 153 pips.

In the upcoming week we expect AUD/USD to show a bullish trend.  The currency pair is trading above the 200 Simple Moving Average and the MACD trades to the upside. A solid breakout above 0.7923 may open a clean path towards 0.7976 and may take a way up to 0.8075. Should 0.7770 prove to be unreliable support, the AUDUSD may sink downwards 0.7671 and 0.7617 respectively. In H4 chart bullish shark pattern favors prospects of a bullish trend. Also to be noted Bullish hammer formation exerts the expectation of uptrend for the pair.

Preference
Buy: 0.7855 target at 0.7975 and stop loss at 0.7765


Alternate Scenario
Sell: 0.7765 target at 0.7618 and stop loss at 0.7855

USD/JPY Weekly Forecast (22nd February 2021 – 26th February 2021)

Fundamental view:

The US dollar has rallied quite a bit against the Japanese yen during the trading week but it has given back about half of the gains. Dollar strength has been largely a function of rising US interest rates, the yield on the 10-year Treasury has gained about 40 basis points this year to 1.336% most of that in February. Anticipation of an additional consumer push for the US economy from a new stimulus package has also helped in the dollar strength though continuing difficulties in the labor market have been a restraint.

Japan Core Machinery Orders yearly report on 17th Feb and Japan CPI yearly report & CPI excl. Food and Energy yearly report on 19th Feb created downtrend atmosphere for the pair whereas Japan GDP quarterly report & GDP yearly report on 15th Feb and Japan Tertiary Industry Activity Index on 16th Feb created uptrend atmosphere for the pair.

The major economic events deciding the movement of the pair in the next week are Fed Chair Powell Testimony, US CB Consumer Confidence Index at Feb 23, BoJ Trimmed Mean Core CPI yearly report, Fed Chair Powell Testimony at Feb 24, Japan Retail Sales monthly report, US GDP quarterly report, US Core Durable Goods Orders monthly report, and US Initial Jobless Claims at Feb 25.

USD/JPY Weekly outlook:

Technical View:

Last week’s high was 0.52% higher than the previous week. Maintaining high at 106.22 and low at 104.90 showed a movement of 132 pips.

In the upcoming week we expect USD/JPY to show a bearish trend. The currency pair is trading above the 200 Simple Moving Average and the MACD trades to the downside. A solid breakout below 104.80 may open a clean path towards 104.19 and may take a way down to 103.48. Should 106.12 prove to be unreliable resistance, the USDJPY may raise upwards 106.83 and 107.44 respectively. In H4 chart, Formation of broadening wedge pattern breakout downside indicates reversal of the trend creating prospects of a bearish trend Along with a bearish engulfing formation braces our expectation.

Preference
Sell: 105.50 target at 104.25 and stop loss at 106.17


Alternate Scenario
Buy: 106.17 target at 107.43 and stop loss at 105.50