USD/JPY Weekly Forecast (15th February 2021 – 19th February 2021)

Fundamental view:

The US dollar has fell against the Japanese yen to break well below the ¥105 level, but then turned around to recapture it. Movement in the pair is tied to improvement in the US economy and Treasury rates. There has also been a minor revival of inflation concerns even though there is no evidence of such and Federal Reserve Chairman Jerome Powell has discounted it. The repetitive size of the US budget deficits over the past five years and money creation by the government is a classic precursor to inflation.

Japan Economy Watchers Index for Future Conditions on 8th Feb and US Federal Budget Balance on 11th Feb created upside movement for the pair whereas Japan Overtime Pay yearly report & BoJ M2 Money Stock yearly report created downside movement for the pair.

The major economic events deciding the movement of the pair in the next week are Japan Industrial Production monthly report at Feb 15, Fed Governor Bowman Speech at Feb 16, Fed Industrial Production yearly report at Feb 17, Japan CPI yearly report, US Initial Jobless Claims, Philadelphia Fed Manufacturing Index at Feb 18, and FOMC Member Rosengren Speech at Feb 19.

USD/JPY Weekly outlook:

Technical View:

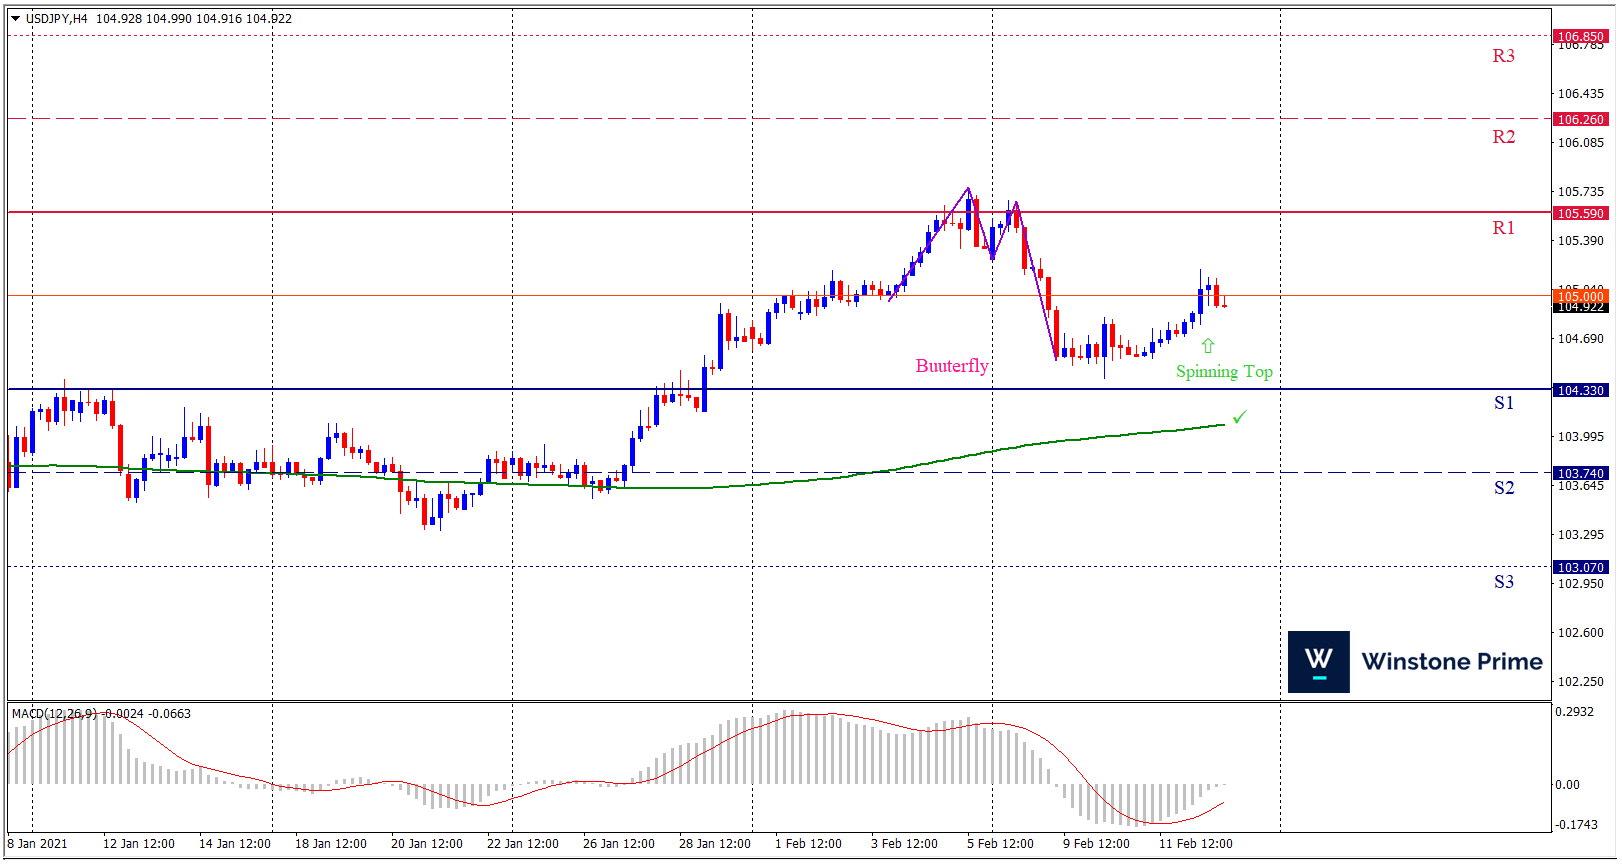
Last week’s high was 0.09% lower than the previous week. Maintaining high at 105.67 and low at 104.41 showed a movement of 126 pips.

In the upcoming week we expect USD/JPY to show a bullish trend. The currency pair is trading above the 200 Simple Moving Average and the MACD trades to the upside. A solid breakout above 105.59 may open a clean path towards 106.26 and may take a way up to 106.85. Should 104.33 prove to be unreliable support, the USDJPY may sink downwards 103.74 and 103.07 respectively. In H4 chart, Formation of bullish butterfly pattern indicates reversal of the trend creating prospects of a bullish trend Along with a bullish spinning top formation braces our expectation.

Preference
Buy: 105.01 target at 106.25 and stop loss at 104.28


Alternate Scenario
Sell:  104.28 target at 103.08 and stop loss at 105.01

Favorable market structure boosts Bitcoin

Bitcoin has gained mass appeal in recent times as the leading digital asset bitcoin (BTC) has reached its highest value ever in 2021. On Thursday morning (EST), BTC spiked to an all-time high (ATH) around 48000$. Earlier in the morning bitcoin was saw an 8.98% increase since then.

The price of Bitcoin (BTC) is showing signs of a newfound rally as it breaks the $40,000 resistance area. There is a combination of optimistic on-chain data points and a favorable market structure that is leading analysts and traders to anticipate an impending Bitcoin breakout to a new all-time high.

There is a combination of optimistic on-chain data points and a favorable market structure that is leading analysts and traders to anticipate an impending Bitcoin breakout to a new all-time high.

One positive on-chain data point that raises the chances of a Bitcoin breakout is the increase of whale addresses. Analysts at Santiment said that Bitcoin whales have continued to accumulate despite the increase in the price of the asset: “The whales of #Bitcoin (1,000+ $BTC addresses) haven’t stopped accumulating, while the mid-tier traders (10-1,000 $BTC) haven’t stopped taking profit as its price hovers around $38,000. Meanwhile, the small addresses have been #FOMO’ing back in rapidly!”

Adding a boost to the Bitcoin, A Bitcoin exchange traded fund for investment firm Accelerate Financial has been approved in Canada. This makes it the first officially approved Bitcoin ETF in North America after the Ontario Securities Commission gave the green light for the institutional product.

Founder and CEO of Accelerate, Julian Klymochko, said; “Bitcoin has been one of the best performing asset classes on a 1-year, 3-year, 5-year and 10-year basis, both absolute and risk-adjusted. Given Bitcoin’s historical track record and future potential, along with its portfolio diversification properties, we are looking forward to offering investors exposure to the asset class in an easy-to-use, low-cost ETF.”

BTC/USD 4 Hour Chart:

Support: 44312.3 (S1), 41789.8 (S2), 39617.5 (S3).

Resistance: 49007.2 (R1), 51179.5 (R2), 53702.1 (R3).

All the catalysts favors Satoshi Nakamoto’s invention – Bitcoin and we expect a bullish trend for BTC/USD.

Fibonacci Trading Strategy with Reversal Candlesticks

Fibonacci trading strategies with reversal candlesticks is the combining of Fibonacci retracements with reversal candlesticks. If you are practicing trade for a long time then you will find that sometimes prices have a great ability to accurately reverse at or near the Fibonacci level.

As per our opinion, it is better to execute trades using only Fibonacci levels along with the use the reversal candlestick for confirmation. The Fibonacci retracement tool works best in a trending market.

Timeframes : 15mins and above would be better.

Instrument : You can use this strategy for any instruments

Indicators : Fibonacci retracement tool

Trading Rules :

 Long Entry:

  • Market must move be in a clear uptrend and then it will start to fall back down eventually.
  • Make use of the Fibonacci tool and click and drag at the start of the trend to the level where trend has started to reverse back down and that would give you the fib retracement levels to watch for.
  • The Fibonacci levels to be used are 38.2, 50 and 61.8. Now just wait to see if price reverses down to any of these levels and if it does so you move to the next step below.
  • Then keep a watch to see if a bullish reversal candlestick forms that will be your buy signal. Then place a buy stop pending order just 2-3 pips above that candlesticks high.
  • To set take profit. Use the previous swing high level (see chart below).
  • Place your stop loss 3-5 pips below its low.
  • If price breaks upwards, your pending buy order will be activated and you will be in a trade.


If you get stopped out on 38.2 level, and price goes down to 50 level, do the same thing again. If you get stopped out on 50 level and if price goes down to the 61.8 level, repeat the process.

Below is the chart of a buy trade setup explaining the process:

Short Entry:

  • Market must move be in a clear downtrend and then it will start to rise up eventually.
  • Make use of the Fibonacci tool and click and drag at the start of the trend to the level where the trend has started to reverse back up and that would give you the fib retracement levels to watch for.
  • The Fibonacci levels to be used are 38.2, 50 and 61.8. Now just wait to see if price reverses down to any of these levels and if it does so you move to the next step below.
  • Then keep a watch to see if a bearish reversal candlestick forms that will be the sell signal. Then place a sell stop pending order just 2-3 pips below that candlesticks low.
  • To set take profit, use the previous swing low level (see chart below).
  • Place your stop loss 3-5 pips above its high.
  • If price breaks downward, your pending sell stop order will be activated and you will be in a trade.
  • If you get stopped out on 38.2 levels, and price goes up to 50 level, do the same thing again. If you get stopped out on 50 levels and if price goes up to the 61.8 level, repeat the process.


Below is the chart of a sell trade setup explaining the process:

Pros :

  • Many traders use it so it’s best to pay attention to it.
  • If the market conditions are right, the risk to reward ratio of this trading system can be in excess of 1:5.
  • It is very simple system to follow.


Cons :

  • No Indicator is 100% accurate, same is with the Fibonacci. Not all the time price will move back to a Fibonacci retracement level
  • Price can sometimes move to a Fibonacci retracement level and not respect it which means you can get stopped out.

Comments from Treasury Secretary favors Aussie

The early-Asian comments from Australia’s Treasury Secretary and upbeat Consumer Inflation Expectations favors the Aussie. Earlier on Thursday, Australia’s Treasury Secretary Kennedy gave comments praising the Pacific major’s pace of economic recovery. He also said, “Looking forward to an increase in business investment this year and next.”

Favoring Aussie, Australian Consumer Inflation Expectations for February grew more than 3.4% forecast and prior to 3.7%.

Elsewhere, The Australian Bureau of Statistics is scheduled to release numbers for the employment change on Thursday (February 18, 2021). According to economists’ view, the economy added 50K new jobs in January 2020, as compared to exactly similar numbers in the month before.

On the other hand, US President Joe Biden had same stance of Donald Trump’s hard stand on Beijing during his first-ever telephonic conversation with Chinese counterpart Xi Jinping. Following Biden’s criticism of China’s economic practices, Reuters released the news that a senior US official hints at changes in trade policy with China.

As a reaction to that, China’s Jinping indirectly warned the US that the confrontations will be a disaster for both the countries while also raising concerns over Taiwan, Hong Kong and Xinjiang.

President Biden took to his Twitter handle, saying: “I spoke today with President Xi to offer good wishes to the Chinese people for Lunar New Year. I also shared concerns about Beijing’s economic practices, human rights abuses, and coercion of Taiwan. I told him I will work with China when it benefits the American people.

AUD/USD 4 Hour Chart:

Support: 0.7708 (S1), 0.7693 (S2), 0.7669 (S3).

Resistance: 0.7746 (R1), 0.7770 (R2), 0.7785 (R3).

Amidst all the catalysts favoring Aussie against greenback, we expect a bullish trend for AUD/USD.