AUD/USD Weekly Forecast (08th February 2021 – 12th February 2021)

Fundamental view:

The Australian dollar has gone back and forth during the week. The greenback was the clear weekly winner, appreciating sharply against most of its major rivals. Aussie’s declines were limited by the equities positive momentum, as Wall Street flirted with record highs. Market players were optimistic amid progress in US President Joe Biden’s stimulus package. Biden proposed a $1.9 trillion which Republicans want to scale back. They counter-proposed a $600 billion package, yet, while negotiations continue, Senate Democrats pushed forward a budgetary manoeuvre that could allow them to pass Biden’s bill without Republicans’ support.

Australia ANZ Job Advertisements monthly report on 1st Feb and US Nonfarm Productivity quarterly report on 4th Feb created uptrend for the pair whereas Australia RBA Index of Commodity Prices yearly report on 1st Feb and US ISM Non-Manufacturing PMI on 3rd Feb created downtrend for the pair.

The major economic events deciding the movement of the pair in the next week are Australia NAB Business Confidence, US JOLTS Job Openings at Feb 09, Australia HIA New Home Sales monthly report, US CPI monthly report, US EIA Crude Oil Stocks Change, Federal Budget Balance at Feb 10 and US Initial Jobless Claims at Feb 11.

AUD/USD Weekly outlook:

Technical View:

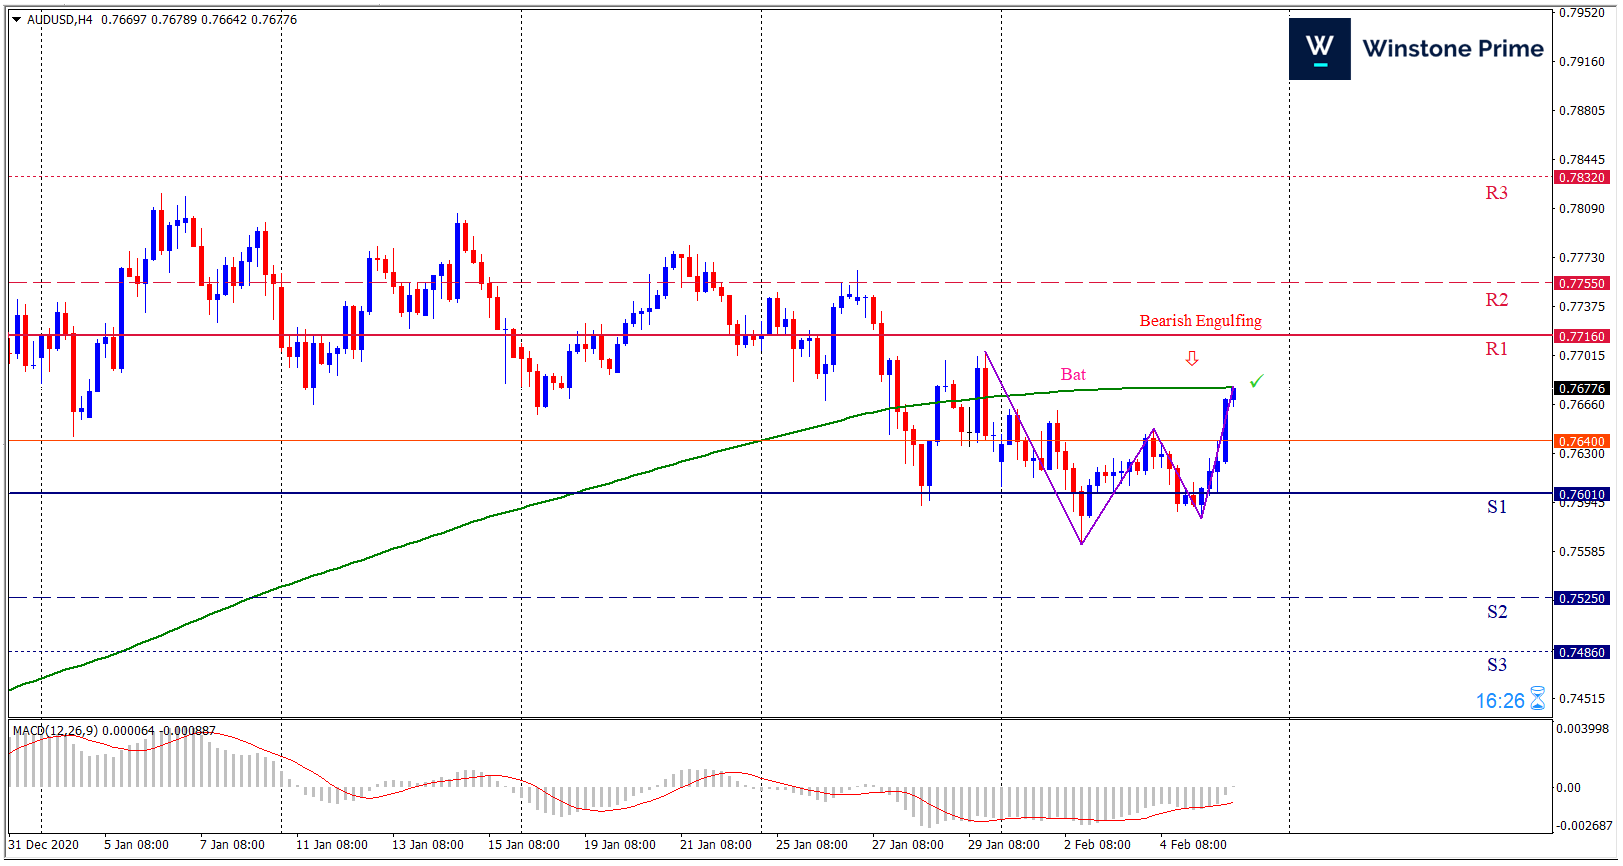
Last week’s high was 1.09% lower than the previous week. Maintaining high at 0.7679 and low at 0.7564 showed a movement of 115 pips.

In the upcoming week we expect AUD/USD to show a bearish trend.  The currency pair is trading below the 200 Simple Moving Average and the MACD trades to the downside. A solid breakout below 0.7601 may open a clean path towards 0.7525 and may take a way down to 0.7486. Should 0.7716 prove to be unreliable resistance, the AUDUSD may raise upwards 0.7755 and 0.7832 respectively. In H4 chart bearish bat pattern favors prospects of a bearish trend. Also to be noted bearish engulfing formation exerts the expectation of downtrend for the pair.

Preference
Sell: 0.7676 target at 0.7536 and stop loss at 0.7721


Alternate Scenario
Buy:  0.7721 target at 0.7831 and stop loss at 0.7676

BTC/USD Weekly Forecast (08th February 2021 – 12th February 2021)

Fundamental view:

In the past week, Bitcoin rallied against greenback. Investors are certainly looking to crypto as an asset class, but bitcoin is still quite volatile. Yet, crypto advocates see bitcoin and ether (ETH) similar to different asset classes, according to Joel Edgerton, chief operating officer of cryptocurrency exchange BitFlyer USA. “My guess is that BTC is like gold and priced by the value it stores, a scarce commodity in price discovery.” 

Crypto exchange Bitfinex claimed Friday it repaid the remaining balance of a $550 million loan to its sister firm, Tether, the issuer of the tether (USDT) stablecoin. Amidst all the catalysts bitcoin rallied against greenback.

The major economic events deciding the movement of the pair in the next week are JOLTS Job Openings at Feb 09, CPI monthly report, EIA Crude Oil Stocks Change, Federal Budget Balance at Feb 10 and Initial Jobless Claims at Feb 11 for US.

BTC/USD Weekly outlook:

Technical View:

Last week’s high was 2.29% higher than the previous week. Maintaining high at 39441.1 and low at 32254.6 showed a movement of 7186 pips.

In the upcoming week we expect BTC/USD to show a bullish trend. The Instrument is trading above the 200 Simple Moving Average and the MACD trades to the upside. A solid breakout above 41299.9 may open a clean path towards 43963.7 and may take a way up to 48486.4. Should 34113.4 prove to be unreliable support, the BTCUSD may sink downwards 29590.7 and 26926.9 respectively. In H4 chart Cup and Handle pattern formation favors prospects of a bullish trend. Bullish engulfing pattern constructs a bullish outlook for the pair in the upcoming week.

Preference
Buy: 38873.8 target at 43962.7 and stop loss at 34108.5


Alternate Scenario
Sell: 34108.5 target at 28740.8 and stop loss at 38873.8

EUR/USD Weekly Forecast (08th February 2021 – 12th February 2021)

Fundamental view:

Last week was a great week for the greenback.  The support for greenback is favored by the persistent optimism about a large, new US stimulus package of $1.9 trillion, with Democrats moving to pass US President  Joe Biden’s bill without Republican support. Worth noting that despite such move Biden and Republican senators are engaged in negotiations to find common ground. Most of the dollar’s strength came from rising US Treasury yields, which maintain their positive momentum on Friday, despite tepid employment figures. 

US ISM-NY Business Conditions Index on 2nd February and Europe Markit Services PMI & CPI monthly report on 3rd February created bullish trend for the pair whereas Europe Retail Sales monthly report on 1st February and US Construction Spending monthly report & ISM Manufacturing Employment on 2nd February created bearish trend for the pair.   

The major economic events deciding the movement of the pair in the next week are Europe Industrial Production yearly report at Feb 08, Europe CPI monthly report, US JOLTS Job Openings at Feb 09, US CPI monthly report, US EIA Crude Oil Stocks Change, Federal Budget Balance at Feb 10 and US Initial Jobless Claims at Feb 11.

EUR/USD Weekly outlook:

Technical View:

Last week’s high was 0.38% lower than the previous week. Maintaining high at 1.2137 and low at 1.1952 showed a movement of 184 pips.

In the upcoming week we expect EUR/USD to show a bearish trend. The currency pair is trading below the 200 Simple Moving Average and the MACD trades to the downside. A solid breakout below 1.1949 may open a clean path towards 1.1859 and may take a way down to 1.1765. Should 1.2133 prove to be unreliable resistance, the EURUSD may raise upwards 1.2227 and 1.2317 respectively. In H4 chart Symmetrical Triangle breakout favors prospects of a bearish trend. Also to be noted bearish harami formation exerts the expectation of downtrend for the pair.

Preference
Sell: 1.2042 target at 1.1895 and stop loss at 1.2138


Alternate Scenario
Buy:  1.2138 target at 1.2272 and stop loss at 1.2042

Firm dollar pressurizes the yellow metal

The yellow metal makes the heaviest losses in over this month, in the earlier of this month. Gold dropped to a nine-week low the previous day before recovering from $1,785. As the broad US dollar gains remain on the table, which weighs on gold prices off-late, the pre-NFP trading lull seems to challenge the commodity trading by press time. That said, the US dollar index (DXY) rises to a fresh high since December 01 while the market’s risk barometer in Asia, S&P 500 Future, also prints mild gains. The yellow metal made the loss due to the firmer dollar.

Boosting greenback, Democrats in the U.S. Senate were poised on Thursday to take a first step toward the ultimate passage of President Joe Biden’s $1.9 trillion COVID-19 relief proposal. U.S. jobless claims decreased further last week, suggesting the labor market was stabilizing.

And further, an ongoing short-squeeze, after short positioning entered the year at historic extremes, the US’ comparatively fast vaccination drive (versus the EU for example),  positive signs coming from the US Congress with regards to the next fiscal stimulus package supports the greenback.

But the Great Lockdown and resulting deep downturn are behind us. When we face the second wave of the pandemic and people become vaccinated, there will be an economic recovery. As well, the Fed has already brought the interest rates to zero – meaning that without the U.S. central bank implementing NIRP, the nominal policy rates reached their lower bound. So, assuming that the Fed will not cut interest rates further and that investors will not expect a further slowing down of the economy, the room for further declines in the real interest rate is limited.

The dollar was set for its best week in three months, while longer-term U.S. Treasury yields rose. “The economic outlook is definitely brighter with vaccines bringing down the daily COVID-19 infections, and the macro data is improving, undermining the demand for precious metals as a store of value”  said an Analysts.

XAU/USD 4 Hour Chart:

Support: 1774.0 (S1), 1754.5 (S2), 1724.2 (S3).

Resistance: 1823.8 (R1), 1854.2 (R2), 1873.6 (R3).

Amidst all the catalysts favoring greenback against the yellow metal, we expect a bearish trend for XAU/USD.