Indicator based trading is a method of trading using technical analysis indicators that help identify market analytics. An indicator handles price data using a mathematical formula. Technical analysis indicators are preferred by some traders because they believe that these indicators allow them to predict exactly what the market will do and where it will go. If you learn to use indicators effectively. Indicator-based trading relies on indicators to analyze prices and provide trading signals. Many indicators provide a specific trading signal that warns the trader that it is time to trade now. This will be easier than learning to read price charts.
Here we will see how it works in Forex market?
Choosing Indicators to Develop a Strategy
The type of indicator a trader uses to develop a strategy depends on what type of strategy the individual plans on building. This relates to trading style and risk tolerance. A trader who seeks long-term moves with large profits might focus on a trend-following strategy, and, therefore, utilize a trend-following indicator such as a moving average. A trader interested in small moves with frequent small gains might be more interested in a strategy based on volatility. Again, different types of indicators may be used for confirmation.
Indicator based Trading Strategies
There are thousands of indicators, and new ones are being created all the time. By combining indicators and using indicators in different ways, there are also countless trading methods involving indicators. The indicator shows a visual representation of the mathematical formula and price inputs. To a skilled chart reader or trader, an indicator often won’t reveal more than what is visible just by analyzing the price chart (or volume) without any indicators.
There are a few common types of indicator strategies: Here we explained two of it.
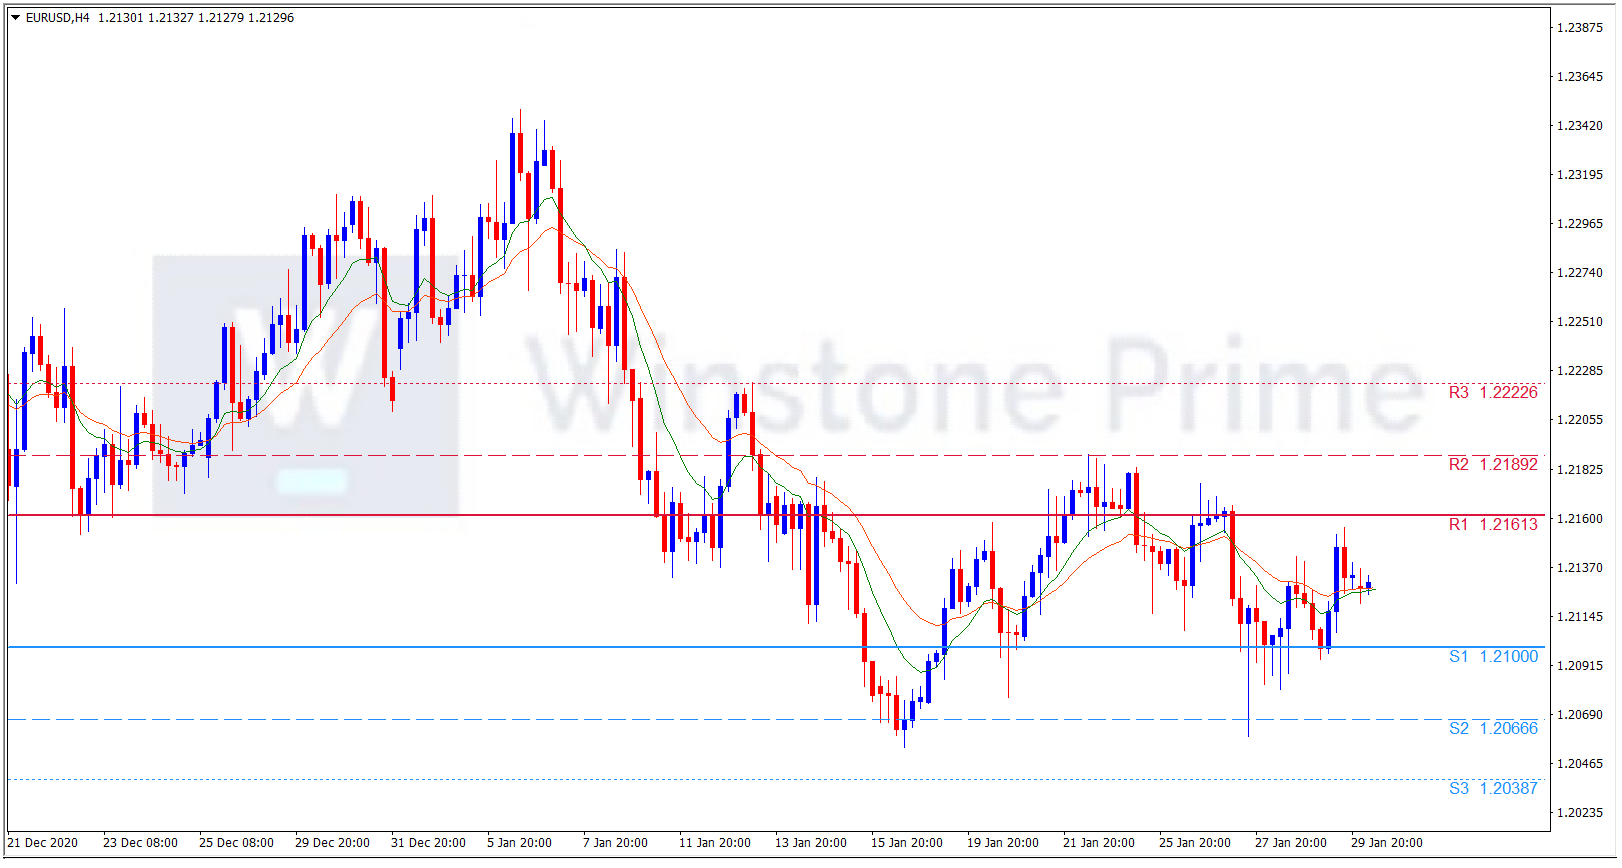
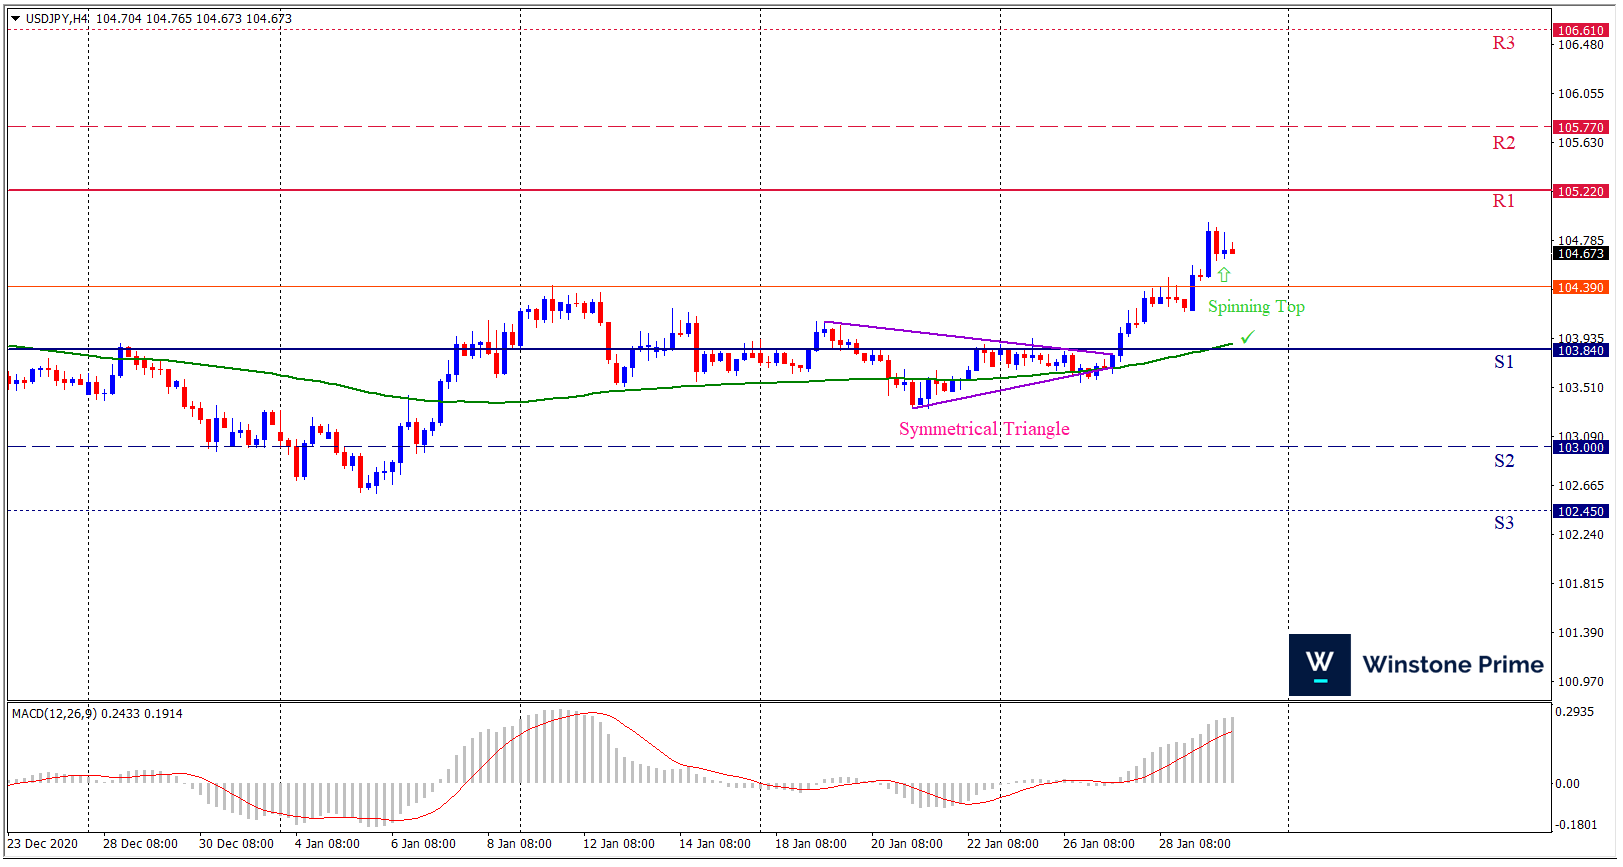
This is when either price or an indicator crosses paths with another indicator. Price crossing a moving average is one of the most straightforward indicator strategies.
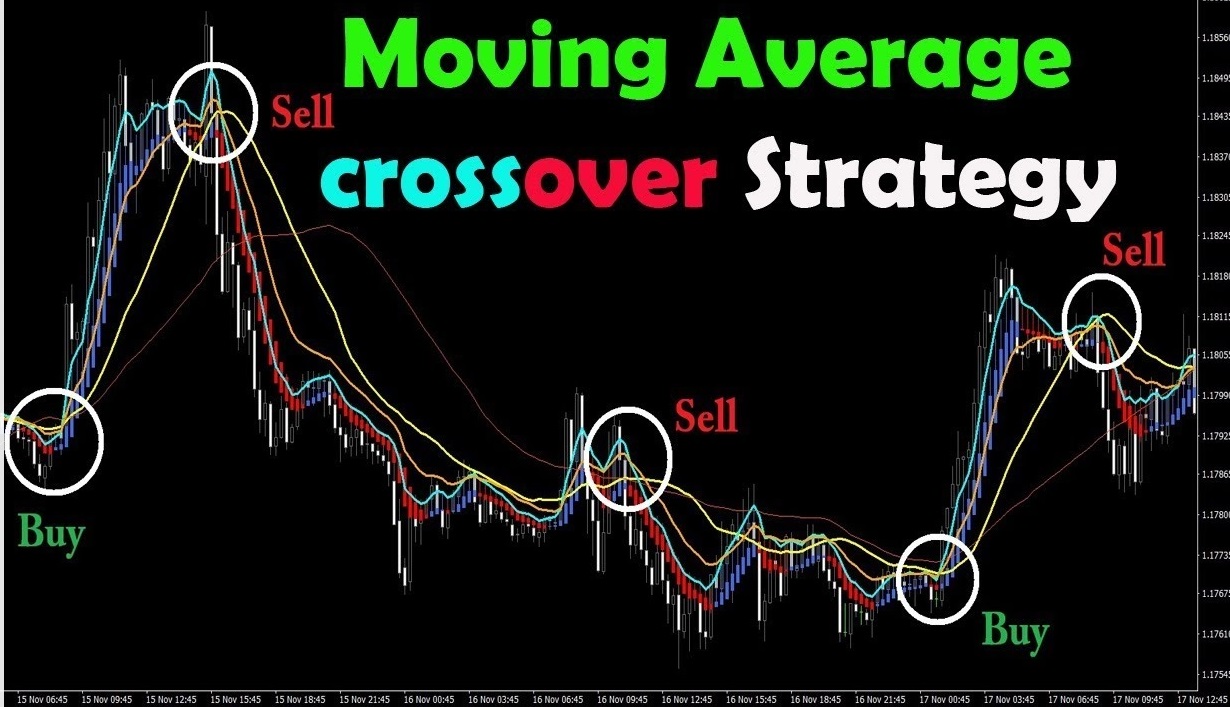
An alternative version of the price-crossover strategy is when a shorter-term moving average crosses a longer-term moving average. This is called a moving average crossover.
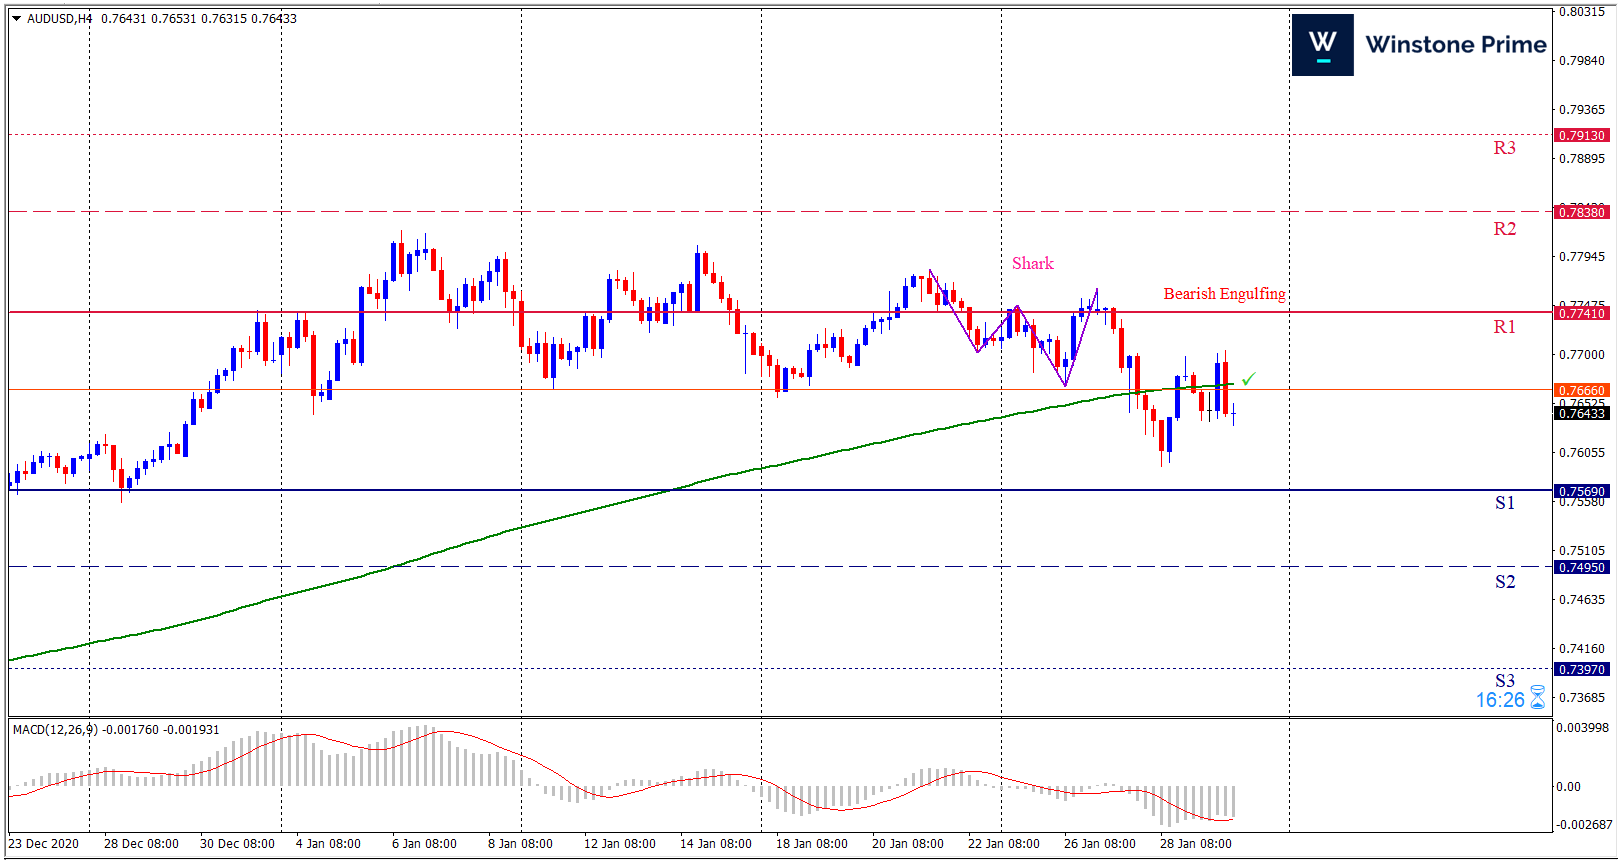
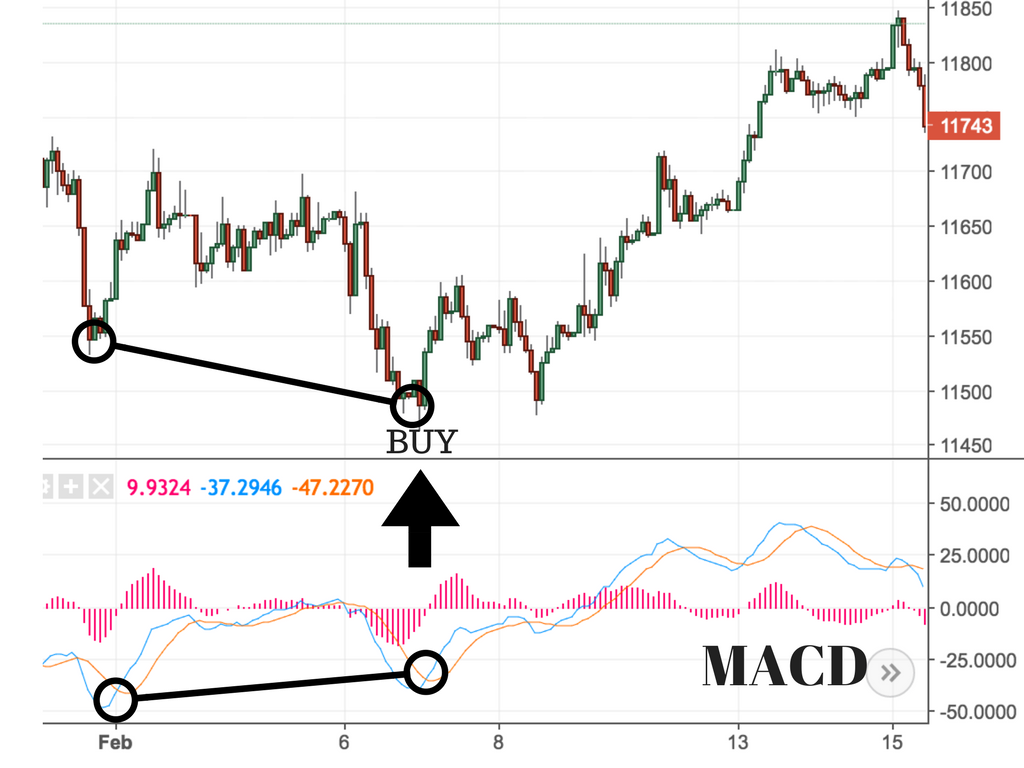
Crossovers occur in many indicators. For example, the MACD provides crossover signals when the MACD line crosses the signal line, or when the MACD or signal line crosses above or below zero.
Other crossover type signals include an RSI moving above 70 or 80 and then back below, indicating the overbought condition may be proceeding with a pullback. Similarly, a drop below 20 or 30, followed by a rally back above 20 or 30, indicates the oversold condition could be relieved by a rally.
Many indicators act as a confirmation tool. If a trader sees an uptrend on the price chart, indicators such as the RSI, MACD or moving averages (as well as many other indicators) help assess the strength of that uptrend. Such indicators also aid in confirming reversals and downtrends.
These are just examples of strategies and not recommendations. Each trader must find indicators that work for them and produce a profit. Many strategies do not produce a profit, even though they are popular and well known.
Advantages of Indicator Based Trading
The main benefit of indicators is that they simplify price moves. New traders may find the simple movements of an indicator easier to interpret than the complex gyrations of the price chart. Note that “easier” in this case doesn’t mean more profitable. Indicators are an excellent tool for learning how to spot weakness or strength in the price though, such as when a trend is weakening.
For the new trader, this may be difficult to assess on a price chart, but with the aid of some indicators, they are made aware of subtle changes they have not yet trained themselves to see on the price chart.
Myths of Indicators
While we are at it, let’s discuss the 3 most common indicator myths and by the end, you will be able to see why the majority of traders is usually wrong about indicator trading.
Let us start with the most ignorant myth first to get it out of the way. Indicator “signals” have no lag in them and a look at how any indicator works will immediately show this. However, an indicator will give you a signal as soon as the candlestick has closed. This is the exact SAME moment when the candlestick gives you the signal too. A candlestick pattern can only be confirmed once the candle has closed too. Only amateurs who blindly jump in and out of the market during the candle duration believe that they experience lag. However, their price action trading is also not profitable because they never wait for confirmed information and react impulsively. Indicators use a “period” setting which means that they analyze the price action over a past time period. This is not the same as lag, but it’s a way of coming up with exact and robust information about what has happened and what is happening right now. Indicators provide meaningful data by looking at a broader market context which usually provides superior results.
- Indicators are messy – price action is clean
This comes very close to being the most ignorant statement. Any chart can be made messy and/or clean. It is not uncommon for price action traders to get lost drawing too many support/resistance lines, trendlines, etc. until they end up with paralysis by analysis because they do not know what to focus on. Or, price action traders who trade purely naked charts easily feel lost when they do not have reference points. The same is true for indicators. You need to find the sweet spot between information overload and not enough. But saying that only price action is a clean way of trading is probably as wrong as it gets.
Really? And what does this even mean? Price action essentially is also just a way of visualizing trading data. Is price action then not just also a derivate of something else? Indicators do not add or subtract anything from price action AND indicators are usually better than looking at price action alone. Each indicator has been built for a very specific purpose and, thus, is the specialist in a certain way of trading. Whereas price action is more a raw form that still has to be put into the right context.
Limitations of Indicator Based Trading

The main drawback of indicators is that while they appear easy to use on the surface, most traders have no idea what is going on “under the hood” of the indicator. So they don’t know when the indicator will provide good signals and bad signals.
Every indicator has a vulnerability; something that makes it likely to provide trade signals at the wrong time, or not provide a trade signal at the right time. If you use an indicator, study the math underneath it. That way you can work out the vulnerabilities. Also, don’t just look at the times the indicator told you do something and you won or lost, also look at times the indicator failed to warn you about getting into a trade or getting out of one.
Another drawback of indicators is that typically they’re just showing what is happening on the price chart, but in a different visual way. Price action traders feel indicators are redundant, and not required, because they can only provide information that price (and volume) charts are providing anyway. Since indicators are calculated based on price (or volume, or both), they tend to lag behind what the price is doing.
Happy Trading