USD/JPY Weekly Forecast (25th January 2021 – 29th January 2021)

Fundamental view:

USD/JPY seems to be noisy in the past week. The outlook of the pair was dominated by the general trend lower in the US dollar. The weak dollar remained the default market mode in the past week. The Bank of Japan (BoJ) kept its base rate at -0.1% as universally expected and warned that the new COVID-19 measures could impact the recovery, saying that services spending will come under “strong downward pressure.” It raised the 2021 GDP estimate to 3.9% from 3.6%.Bank of Japan Governor Haruhiko Kuroda said he did not think the risk of deflation was high even as annual National CPI fell 1.2% in December, the third negative month in a row. He suggested that the bank had extended sufficient stimulus to ease the shock from the pandemic, at least for now.

Last week news, Japan Industrial Production on 18th January and Japan CPI excl. Food and Energy yearly report and Core CPI yearly report on 22nd January created bullish trend for the pair and US NAHB Housing Market on 20th January and US Initial Jobless Claims on 21st January created bearish trend for the pair.

The major economic events deciding the movement of the pair in the next week are BoJ Monetary Policy Meeting Minutes at Jan 25, US CB Consumer Confidence Index at Jan 26, Japan Retail Sales monthly report, US Core Durable Goods Orders monthly report, Fed Interest Rate Decision at Jan 27, US GDP quarterly report and US Initial Jobless Claims at Jan 28.

USD/JPY Weekly outlook:

Technical View:

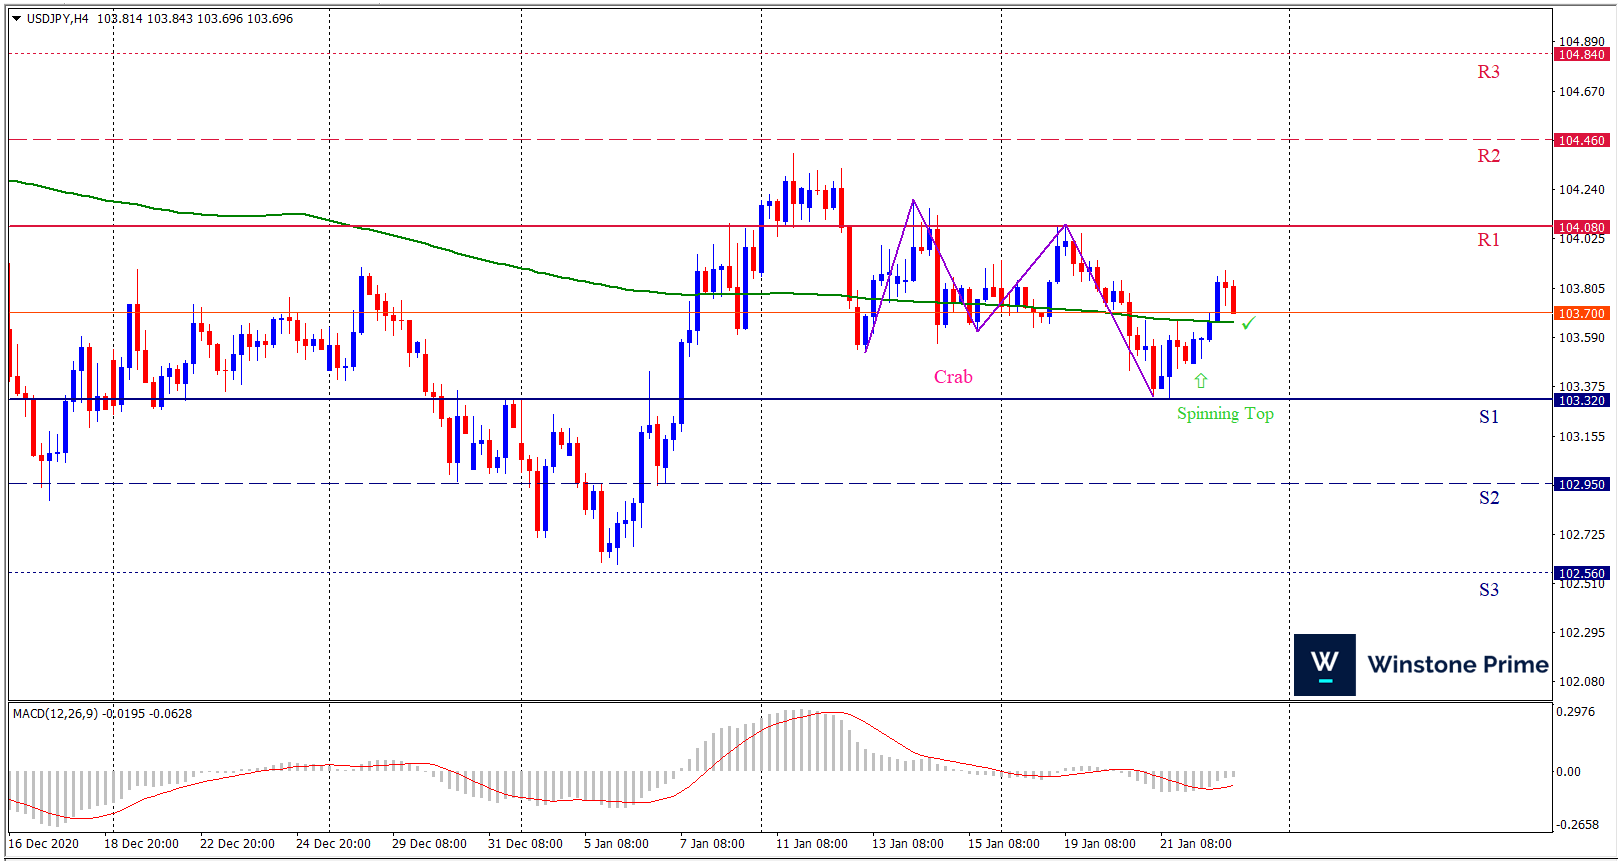
Last week’s high was 0.30% lower than the previous week. Maintaining high at 104.09 and low at 103.33 showed a movement of 76 pips.

In the upcoming week we expect USD/JPY to show a bullish trend. The currency pair is trading above the 200 Simple Moving Average and the MACD trades to the upside. A solid breakout above 104.08 may open a clean path towards 104.46 and may take a way up to 104.84. Should 103.32 prove to be unreliable support, the USDJPY may sink downwards 102.95 and 102.56 respectively. In H4 chart, Formation of bullish crab pattern indicates reversal of the trend creating prospects of a bullish trend Along with a bullish spinning top formation braces our expectation.

Preference
Buy: 103.68 target at 104.45 and stop loss at 103.27


Alternate Scenario
Sell:  103.27 target at 102.58 and stop loss at 103.68

GBP/USD Weekly Forecast (25th January 2021 – 29th January 2021)

Fundamental view:

The British pound went back and forth during the course of the trading week. President Joe Biden’s fresh energy has been inspiring markets – the freshly inaugurated Commander-in-Chief’s efforts to pass his $1.9 trillion stimulus bill and call for unity have boosted markets and weighed on the safe-haven dollar.

Prime Minister Boris Johnson is focusing on the appalling mortality figures, investors are eyeing immunization statistics to monitor progress – as the PM tied the easing of restrictions to the campaign. The UK is the leader in the West, and reaching 10% from the current 7.47% of the population would be a substantial achievement.

Britain Public Sector Net Borrowing on 22nd January favored downtrend whereas US NAHB Housing Market Index on 20th January and US Initial Jobless Claims on 21st January favored uptrend for the pair last week.

The major economic events deciding the movement of the pair in the next week are BoE Governor Bailey Speech at Jan 28, US CB Consumer Confidence Index at Jan 26, UK Nationwide HPI yearly report, US Core Durable Goods Orders monthly report, Fed Interest Rate Decision at Jan 27, US GDP quarterly report and US Initial Jobless Claims at Jan 28.

GBP/USD Weekly outlook:

Technical View:

Last week’s high was 0.26% higher than the previous week. Maintaining high at 1.3746 and low at 1.3520 showed a movement of 226 pips.

In the upcoming week we expect GBP/USD to show a bearish trend.  The currency pair is trading above the 200 Simple Moving Average and the MACD trades to the downside. A solid breakout below 1.3554 may open a clean path towards 1.3423 and may take a way down to 1.3327. Should 1.3780 prove to be unreliable resistance, the GBPUSD may raise upwards 1.3876 and 1.4007 respectively. Chart formation of symmetrical triangle pattern in H4 chart favors prospects of a bearish trend. Three black crows pattern formation escalates the expectation for a bearish trend.

Preference
Sell: 1.3701 target at 1.3484 and stop loss at 1.3785


Alternate Scenario
Buy:  1.3785 target at 1.4006 and stop loss at 1.3701

BTC/USD Weekly Forecast (25th January 2021 – 29th January 2021)

Fundamental view:

After hitting a new all-time high of $41,950, Bitcoin had a major 31% correction down to $28,560. A lot of cryptocurrency enthusiasts are concerned about the end of the current Bitcoin rally as the digital asset has dropped by more than 30% since its all-time high. However, most on-chain metrics and indicators suggest the run has just barely started.

Joe Biden, the 46th president of the United States, has frozen all rulemaking carried over from the previous administration, the White House announced after his inauguration Wednesday. This would include the proposal by the Financial Crimes Enforcement Network (FinCEN) affecting cryptocurrency wallets. The freeze is “In order to ensure that the president’s appointees or designees have the opportunity to review any new or pending rules.”

The major economic events deciding the movement of the pair in the next week are CB Consumer Confidence Index at Jan 26, Core Durable Goods Orders monthly report, EIA Crude Oil Stocks Change, Fed Interest Rate Decision at Jan 27, GDP quarterly report and Initial Jobless Claims at Jan 28 for US.

BTC/USD Weekly outlook:

Technical View:

Last week’s high was 5.90% lower than the previous week. Maintaining high at 37800.1 and low at 28743.3 showed a movement of 9057 pips.

In the upcoming week we expect BTC/USD to show a bearish trend. The Instrument is trading below the 100 Simple Moving Average and the MACD trades to the downside. A solid breakout below 28295.0 may open a clean path towards 23990.8 and may take a way down to 19238.2. Should 37351.8 prove to be unreliable resistance, the BTCUSD may raise upwards 42104.3 and 46408.6 respectively. In H4 chart bearish gartley pattern formation favors prospects of a bearish trend. Shooting star pattern constructs a bearish outlook for the pair in the upcoming week.

Preference
Sell: 32601.2 target at 26256.8 and stop loss at 37355.8


Alternate Scenario
Buy: 37355.8 target at 43103.3 and stop loss at 32601.2

AUD/USD Weekly Forecast (25th January 2021 – 29th January 2021)

Fundamental view:

The AUD/USD pair has made little progress this week as investors struggled to maintain the optimism alive. Australia reported on Thursday a week without new coronavirus contagions, although a foreign visitor tested positive on Friday. The country reported a total of 28,755 contagions since the pandemic started, and 909 deaths linked to the virus. And on the other hand, In the US, the death toll has reached 420K after reporting over 25 million cases, although the change of government implies a fresh approach to the pandemic.

Australia Employment Change on 20th January and Australia Commonwealth Bank Services PMI & Retail Sales monthly report on 21st January created downtrend for the pair whereas Australia HIA New Home Sales on 19th January and US Initial Jobless Claims 4-Week Average on 20th January created uptrend for the pair. 

The major economic events deciding the movement of the pair in the next week are US CB Consumer Confidence Index at Jan 26, Australia CPI quarterly report, US Core Durable Goods Orders monthly report, Fed Interest Rate Decision at Jan 27, US GDP quarterly report, US Initial Jobless Claims at Jan 28, and Australia PPI quarterly report at Jan29.

AUD/USD Weekly outlook:

Technical View:

Last week’s high was 0.30% lower than the previous week. Maintaining high at 0.7782 and low at 0.7659 showed a movement of 123 pips.

In the upcoming week we expect AUD/USD to show a bearish trend.  The currency pair is trading below the 100 Simple Moving Average and the MACD trades to the downside. A solid breakout below 0.7654 may open a clean path towards 0.7595 and may take a way down to 0.7531. Should 0.7777 prove to be unreliable resistance, the AUDUSD may raise upwards 0.7841 and 0.7901 respectively. In H4 chart Ascending Triangle downside breakout favors prospects of a bearish trend. Also to be noted shooting star formation exerts the expectation of downtrend for the pair.

Preference
Sell: 0.7715 target at 0.7596 and stop loss at 0.7782


Alternate Scenario
Buy:  0.7782 target at 0.7900 and stop loss at 0.7715