Despite of positive reports, Aussie is falling

Aussie seems to be in negative trend despite the reports being positive. China’s Consumer Price Index (CPI) and Producer Price Index (PPI) for December crossed upbeat forecasts while flashing 0.2% and -0.4% YoY figures. Monthly CPI 0.7% versus 0.4% expected -0.6% prior has to be noted. Earlier today, Australia’s final reading of November’s Retail Sales rose past-7.00% forecast to 7.1% whereas a monthly inflation report from the Melbourne Institute grew beyond 1.3% YoY to 1.5%. However, challenges to risks weigh on the Aussie.

Worsening coronavirus (COVID-19) conditions and the Sino-American tussle are the reasons for the tension, a main contributor for the tension is the Donald Trump. Although Greater Brisbane is free from activity restrictions after  3 days lockdown while finding zero cases of the pandemic, chatters concerning the spread of the virus strain, found in the UK and South Africa, weigh on risks.

Adding further, the US is about to consider more sanctions on China. The Trump administration recently raised standard for doing business with eight Chinese applications and pushed the New York Stock Exchange (NYSE) to rethink over the delisting of stocks from Beijing. Also Goldman Sachs and Morgan Stanley are considering reducing holdings from Hong Kong due to the same reason.

Another news that joins the risk is cyber attack that breached the data systems of New Zealand’s central bank also affected other users of a third-party file sharing application, the bank said on Monday. The breach was contained but it will take time to determine the impact, Adrian Orr, the governor of the Reserve Bank of New Zealand, said in a statement. “We have been advised by the third party provider that this wasn’t a specific attack on the Reserve Bank, and other users of the file-sharing application were also compromised,” Orr added.

AUD/USD 4 Hour Chart:

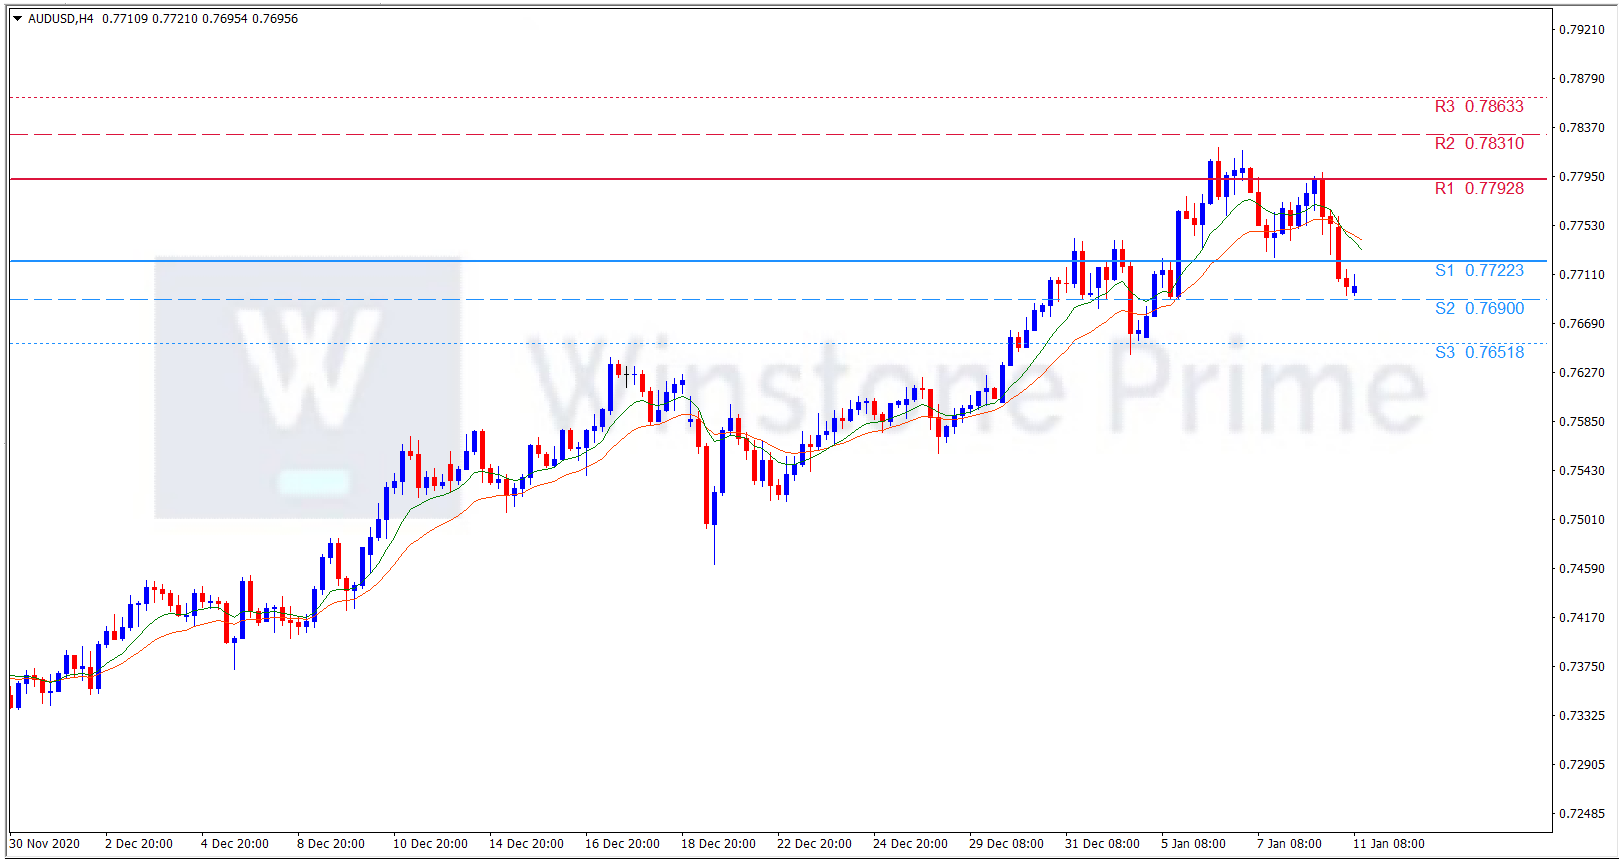
Support: 0.7722 (S1), 0.7690 (S2), 0.7652 (S3).

Resistance: 0.7793 (R1), 0.7831 (R2), 0.7863 (R3).

Instead of the positive reports, Aussie seems to be under pressure and we expect a bearish trend for AUD/USD.

XAU/USD Weekly Forecast (11th January 2021 – 15th January 2021)

Fundamental view:

The early part of this week started off encouraging for Gold bulls. The yellow metal continued to push higher, riding a trendline that had built in December as buyers got back on the bid. This brought hope that bulls would be able to continue pushing prices higher but it snapped back aggressively on Wednesday before getting pulverized on Friday, leaving a number of question marks around long-term Gold trends.

The selling pressure surrounding the greenback that intensified in the last week of 2020 remained intact earlier in the week and helped XAU/USD push higher. However, the greenback gathered strength in the second half of the week on the back of soaring US Treasury bond yields and forced XAU/USD to reverse its direction.

The major economic events deciding the movement of the pair in the next week are JOLTS Job Openings at Jan 12, EIA Crude Oil Stocks Change, CPI monthly report at Jan 13, Initial Jobless Claims, Fed Chair Powell Speaks at Jan 14, and Retail Sales monthly report at Jan 15 for US.

XAU/USD Weekly outlook:

Technical View:

Last week’s high was 2.98 % higher than the previous week. Maintaining high at 1959.3 and low at 1828.3 showed a movement of 1310 pips.

In the upcoming week we expect XAU/USD to show a bullish trend.  The Instrument is trading below the 200 Simple Moving Average and the MACD trades to the downside. A solid breakout above 1929.5 may open a clean path towards 2009.9 and may take a way up to 2060.6. Should 1798.5 prove to be unreliable support, the XAUUSD may sink downwards 1747.8 and 1667.4 respectively. In H4 chart bullish crab pattern formation favors prospects of a bullish trend. Also to be noted Bullish engulfing formation exerts the expectation of uptrend for the pair.

Preference
Buy: 1834.2 target at 1928.8 and stop loss at 1794.7


Alternate Scenario
Sell:  1794.7 target at 1703.5 and stop loss at 1834.2

GBP/USD Weekly Forecast (11th January 2021 – 15th January 2021)

Fundamental view:

The British pound initially tried to rally a bit during the course of the week but gave back the gains rather quickly as as the UK entered a harsh lockdown to prevent hospitals from collapsing due to the new virus strain. US Democrats’ win of the Senate sparked a mixed dollar reaction. Prime Minister Boris Johnson made a second somber national address in as many weeks, this time announcing a harsh shuttering. The government responded to the surge in cases, deaths, and hospitalizations, with the latter surpassing levels seen in the first wave. That led to the downside momentum for the pound.

In the previous week, US EIA Gasoline Stocks Change on 6th January and Europe CPI yearly report on 7th January framed uptrend movement for the pair whereas BoE M4 Money Supply monthly report on 4th January and Britain Markit/CIPS Services PMI on 6th January framed downtrend movement for the pair.

The major economic events deciding the movement of the pair in the next week are BoE Governor Bailey Speech at Jan 11, US JOLTS Job Openings at Jan 12, US CPI monthly report at Jan 13, US Initial Jobless Claims, Fed Chair Powell Speaks at Jan 14, UK GDP monthly report, and US Retail Sales monthly report at Jan 15.

GBP/USD Weekly outlook:

Technical View:

Last week’s high was 0.13% higher than the previous week. Maintaining high at 1.3704 and low at 1.3533 showed a movement of 171 pips.

In the upcoming week we expect GBP/USD to show a bearish trend.  The currency pair is trading below the 50 Simple Moving Average and the MACD trades to the downside. A solid breakout below 1.3495 may open a clean path towards 1.3428 and may take a way down to 1.3324. Should 1.3666 prove to be unreliable resistance, the GBPUSD may raise upwards 1.3771 and 1.3838 respectively. Chart formation of bearish gartley pattern in H4 chart favors prospects of a bearish trend. Bearish harami pattern formation escalates the expectation for a bearish trend.

Preference
Sell: 1.3561 target at 1.3429 and stop loss at 1.3671


Alternate Scenario
Buy:  1.3671 target at 1.3837 and stop loss at 1.3561

USD/JPY Weekly Forecast (11th January 2021 – 15th January 2021)

Fundamental view:

The US dollar initially fell during the course of the week, but then turned around to show signs of strength. Demand for the American currency surged mid-week, amid hopes things will start falling into place this year. Coronavirus immunization through different vaccines lifts odds for an economic comeback in the second semester of the year, while unprecedented monetary stimulus has chances of being increased. Finally, and after some turmoil in the US, President Donald Trump announced an upcoming “orderly transition” on January 20.

In the last week, Japan Markit Manufacturing PMI on 4th January and Japan BoJ Monetary Base yearly report on 5th January favors downward movement whereas Japan Consumer Confidence Index on 6th January and Japan Labor Cash Earnings yearly report & Real Wage yearly report on 7th January favors upward movement for the pair.

The major economic events deciding the movement of the pair in the next week are US JOLTS Job Openings at Jan 12, BoJ Corporate Goods Price Index monthly report, US CPI monthly report at Jan 13, US Initial Jobless Claims, Fed Chair Powell Speaks at Jan 14, Japan Tertiary Industry Activity Index monthly report, and US Retail Sales monthly report at Jan 15.

USD/JPY Weekly outlook:

Technical View:

Last week’s high was 0.19% higher than the previous week. Maintaining high at 104.09 and low at 102.59 showed a movement of 150 pips.

In the upcoming week we expect USD/JPY to show a bullish trend. The currency pair is trading above the 100 Simple Moving Average and the MACD trades to the upside. A solid breakout above 104.46 may open a clean path towards 105.02 and may take a way up to 105.95. Should 102.96 prove to be unreliable support, the USDJPY may sink downwards 102.03 and 101.46 respectively. In H4 chart, Formation of rounding bottom pattern indicates reversal of the trend creating prospects of a bullish trend Along with a bullish hammer formation braces our expectation.

Preference
Buy: 103.75 target at 105.01 and stop loss at 102.91


Alternate Scenario
Sell:  102.91 target at 101.47 and stop loss at 103.75