Double Top Trading Strategy

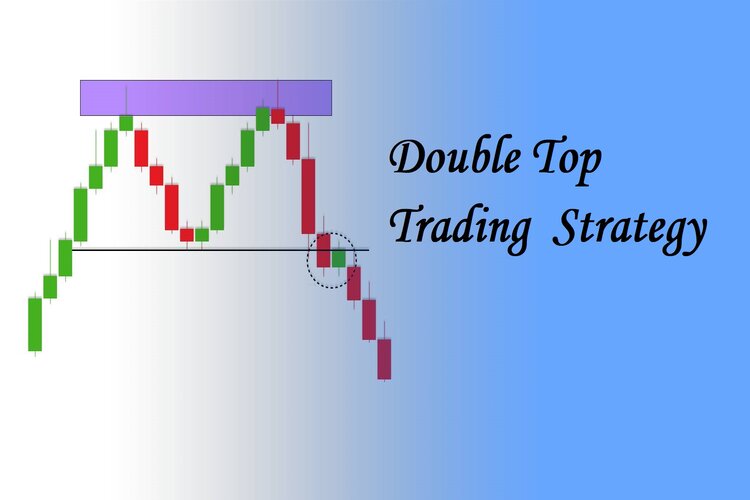
The double top chart pattern is a reversal chart pattern. It can be seen in all timeframes. If often gets formed when price has moved upwards for an extended amount of time. The tops or swing highs are formed when price hits a certain resistance levels where it cannot break it to the upside.

This strategy is exactly the opposite of double bottom trading strategy.

Timeframes : Works best on 15mins chart and above

Instrument : You can use in any Instrument

Note: Know how to identify Bearish Reversal Candlesticks.

Identifying the double top chart pattern:

It is easy to identify a double top chart pattern.

  • Look for Two tops, top1 & top2 (or swing highs or peaks) that are almost on the same price level.
  • There must be equal distance in terms of time it takes to form the high(peaks)
  • Few traders like to include a third requirement to classify a double top: volume. They see a decrease in volume on the second high. This gives them added confidence that the buyers are losing steam!


Let us explain with a chart below:

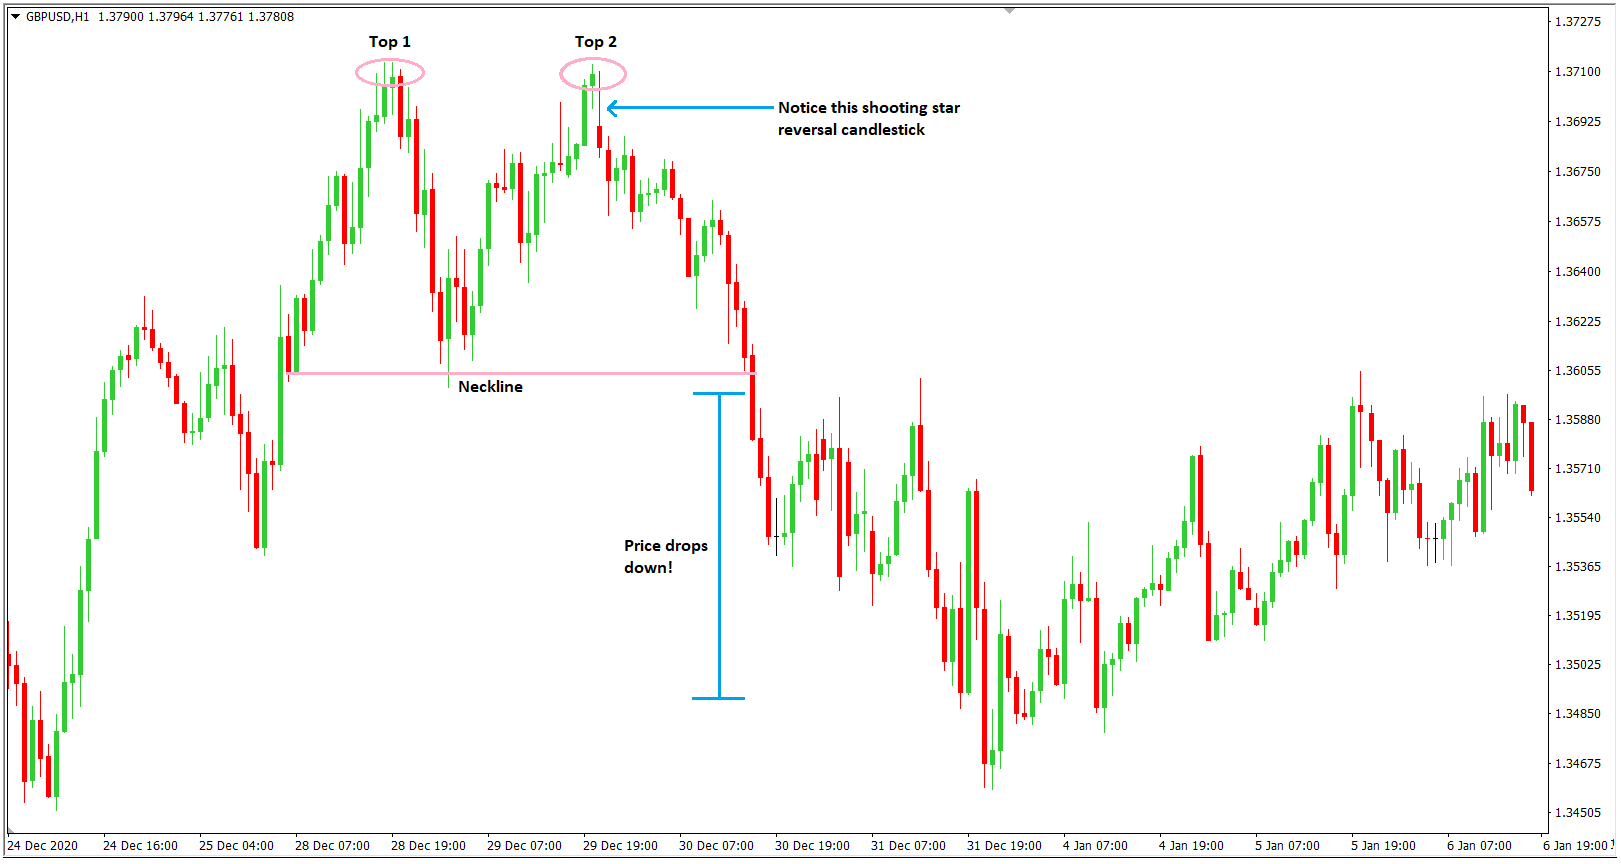
Let us understand using a chart:

  • Look for two tops or peaks forming after a strong move upward.
  • Also notice that the second top or swing high (or peak) is unable to break the second top or swing high(top2).
  • When price fails to break this resistance level above top2, we get a strong indication that a reversal is going to occur.
  • You can now use volume as a further confirmation to confirm if buying pressure is decreasing as well.


When you see all the things happening as above, you should take your trade because price tend to move fast downward once top 2 resistance level is not broken to the upside.

Trading Rules :

Double top trading strategy is really simple and there are two ways to trade it:

  • The Aggressive Entry
  • The conservative Entry


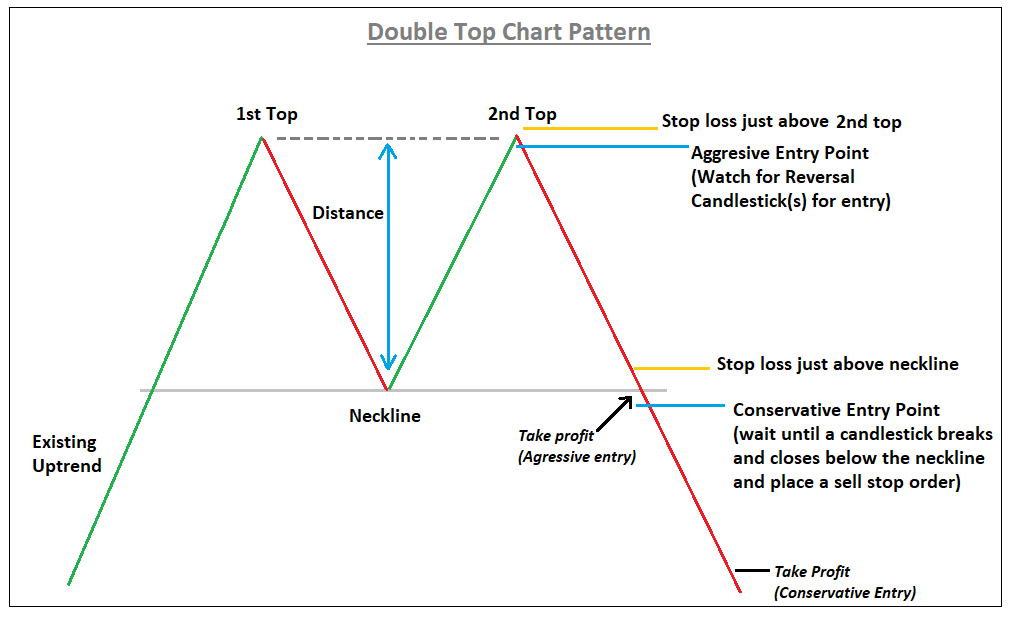
The Aggressive Trade Entry Rules:

  • After the second top is formed, watch for a bearish reversal candlestick formation.
  • Then Place a sell stop order just 3-5 pips below the low of the bearish reversal candlestick formation.
  • After that place your stop loss at either a few pips above the bearish reversal candlestick formation, 5-10 pips or you can place it just a little bit outside of both the 1st top the 2nd top, anywhere from 5-20 pips.
  • Set take profit at the neckline.


The Conservation Trade Entry Rules:

  • Wait till the price breaks below that neckline. Just make sure the candlestick that breaks the neckline must close below it.
  • After that place a sell stop order 3-5 pips below that breakout candlesticks low.
  • Then place your stop loss anywhere from 3-10 pips above the neckline or just above the high of the candlestick.
  • Set Take profit by calculating the distance in pips between the neckline and the 1st top (or the second top, whichever you prefer) and use that number take profit target price level.


But the problem using the conservation approach is stop loss would be too large if the neckline is too far away from the tops.

Pros :

  • You can make a lot of money as the downward move that happen after the formation of the 2nd top can go a long way, even for weeks, if you are trading off the daily chart and if you continue to ride the trend.
  • If you are confident at what to look for, it is the best strategy.
  • Risk for each trade is far better compared to other trading strategies just because you will be using support and resistance levels to place your stop loss.


Cons :

  • Sometimes you can get tricked. You may come across situations where there will be price spikes just to trigger all the stop losses placed just above top1 and it would seem as there would be a breakout to the upside but this is just a trick. Later you will see price fall back all the way down. (The key is being vigilant and if a price spike takes you out with loss, then watch and wait to see if you enter on the 2nd Just wait for another reversal candlestick. Even if it is the spike candlestick, enter again!)
  • Avoid trading in lower time frame using this strategy.

Downside momentum for greenback favors CAD

USD/CAD gains downside momentum. Democrats won effective control of the Senate this week, giving President-elect Joe Biden scope to push through more spending, which analysts say will be negative for bonds and the dollar.

In this week, U.S. reported that ISM Manufacturing PMI increased from 57.5 in November to 60.7 in December while analysts believed that it would decline to 56.6. The manufacturing segment remains strong despite the second wave of the virus which is good for riskier assets.

The U.S. reported that Initial Jobless Claims declined from 790,000 (revised from 787,000) to 787,000 while Continuing Jobless Claims decreased from 5.2 million (revised from 5.22 million) to 5.07 million. The reports were a bit better than analysts expected but it is clear that the job market needs additional support.

On the other hand, For the past several months, BOC Governor Tiff Macklem has been crystal clear regarding the BOC’s crisis policies, saying that “if you are a household considering making a major purchase, if you’re a business considering investing, you can be confident that interest rates will be low for a long time.” Recall that at the December BOC rate decision, BOC Governor Macklem suggested that rates could remain at their ultra-low level, “probably” until 2023.

Accordingly, neither interest rate cut nor hike expectations have produced any significant movement since the remarks made last month by BOC Governor Macklem. Through December 2021, there is only a 7% chance of a 25-bps rate cut by the BOC. Having previously dismissed the possibility of negative interest rates, this seems like a non-issue for the Canadian Dollar.

USD/CAD 4 Hour Chart:

Support: 1.2658 (S1), 1.2625 (S2), 1.2587 (S3).

Resistance: 1.2728 (R1), 1.2766 (R2), 1.2798 (R3).

Investors now await U.S. nonfarm payrolls later on Friday for clues on whether significantly more stimulus will be needed to keep the economic recovery alive. In the meantime we expect a bearish trend for USD/CAD.

Fear of covid-19 pressurizes Yen

Japan coronavirus advisory panel is out with its recommendations on Thursday, as the third wave of the virus grips the economy and threatens to derail its post-pandemic recovery. The panel suggested that a state of emergency declaration is needed for Tokyo and three nearby prefectures from January 8 to February 7. 

Earlier today, it was reported that the Japanese PM Yoshihide Suga is likely to make a COVID-19 announcement at 0900 GMT. This comes after Japan’s daily corona virus infections totaled 6,004 cases, topping 6,000 for the first time since the start of the outbreak last year, a News tally reported.

Greenback made a recovery against yen after a long time. The recovery moves recently dwindled although risk catalysts recover on the safety of the US Capitol Hill building after a mob of President Donald Trump’s supporters attacked the premises before a few hours. Global traders currently await American policymakers’ move on the Electoral College vote as an immediate catalyst.

After a few hours of drama in Washington, coupled with one woman’s death, the protesters over President Trump’s defeat in the US 2020 elections seem to have been detained as officials convey safe passage in Capitol Hill. Even so, American Congress is angry with Mr. Trump and is ready to move forward in welcoming Democrats in the Senate after Jon Ossoff won in the Georgian Senate race.

Elsewhere, The US 10-year breakeven inflation rate rose to 2.06% on Wednesday, the highest level since November 2018, having bottomed near 0.5% in March 2020, according to data provided by the St. Louis Federal Reserve. Markets collapsed in March on fears of a corona virus-induced recession.  The 10-year US treasury yield has risen above 1% for the first time since March 2020.

USD/JPY 4 hour chart:

Support: 102.60 (S1), 102.17 (S2), 101.75 (S3).

Resistance: 103.45 (R1), 103.87 (R2), 104.30 (R3).

The fear of Covid-19 impacts yen negatively and we expect a bullish trend for USD/JPY.

Increase in Institutional investors favors BTC

Bitcoin just set a new all-time high just minute ago, exploding from $34,000 to $35,800. The cryptocurrency has since retraced slightly to $35,300 as the breakout has slowed to some extent. BTC’s rally appears to be a by-product of news that the democrats are expected to win the Georgia Senate elections, which will determine the state of Congress in the years ahead. This “blue wave” that is expected by the pundits will lead to further monetary and fiscal stimulus than if it was a Republican-led Senate.

The sudden fear of inflation caused by unprecedented money printing also acts as the reason for rise of Bitcoin. Each new round of stimulus money resulted in yet another massive rally in the cryptocurrency.

The increase in BTC’s price is also triggered by institutional investors who now account for a huge portion of Bitcoin’s hodlers over the past year. The most recent additions to this growing list include Skybridge Capital, with investments of $25 million in December 2020, and MassMutual, with investments of $100 million in Bitcoin, in the same month.

As expected, the institutions that took huge positions in the crypto-asset earlier in the year have already recorded significant returns on their investments. Most notably, Micro strategy recorded gains upwards of $1 billion on its Bitcoin investment.

As popular Bitcoin proponent Anthony Pompliano was quick to note, “There is just not enough Bitcoin available for all the institutions that want to own some now.” According to Pompliano, the price has to continue to move upwards in order to accommodate everyone who wants to own the crypto-asset.

BTC/USD 4 Hour Chart:

Support: 31023.1 (S1), 28285.6 (S2), 26681.7 (S3).

Resistance: 35364.5 (R1), 36968.4 (R2), 39705.9 (R3).

In the prevailing atmosphere where Bitcoin is forming a continuous rally, we expect a bullish trend for BTC/USD.