EUR/USD Weekly Forecast (28th December 2020 – 01st January 2021)

Fundamental view:

The Euro went back and forth during the course of the week, as it looks like it is a bit overextended. Furthermore, the United States is very possibly going to have an even bigger stimulus package than previously agreed upon, so that could also lift the Euro.

Europe Consumer Confidence on 21st Dec and Europe German GfK Consumer Climate on 22nd Dec created bullish atmosphere for the pair whereas US Final GDP quarterly report & US Richmond Manufacturing Index on 22nd Dec and US Durable Goods Orders on 23rd Dec created bearish atmosphere for the pair.

The major economic events deciding the movement of the pair in the next week are Jobseekers Total at Dec 28, US Dallas Fed Manufacturing Index at Dec 28, US S&P/CS HPI Composite-20 y/y at Dec 29, Euro CPI monthly report, US Pending Home Sales monthly report, US EIA Crude Oil Stocks Change at Dec 30, and US Initial Jobless Claims at Dec 31.

EUR/USD Weekly outlook:

Technical View:

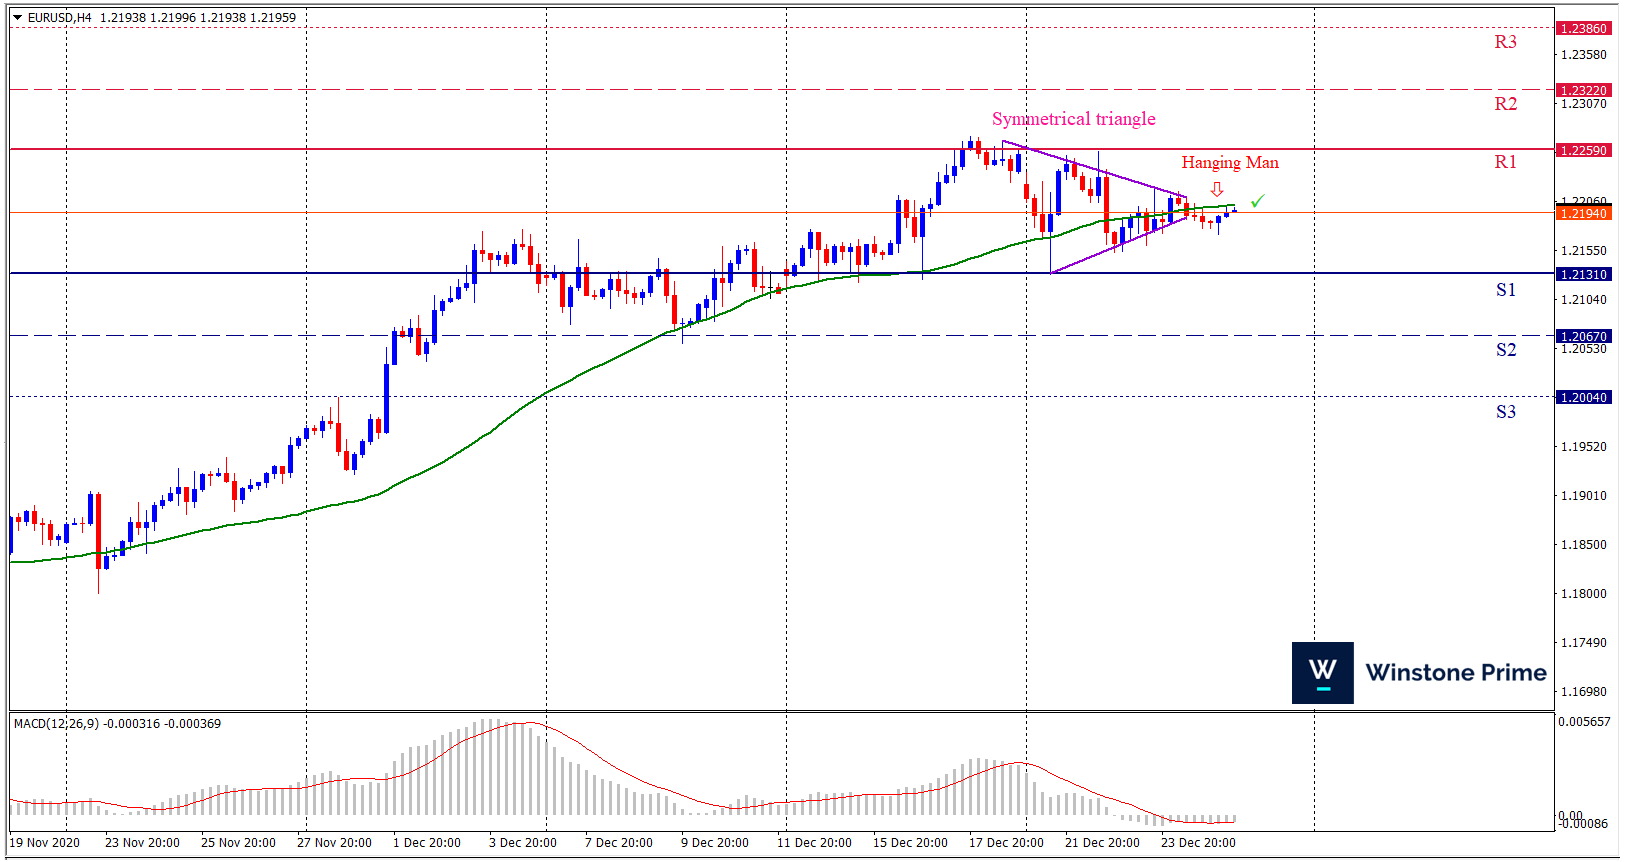
Last week’s high was 0.13% lower than the previous week. Maintaining high at 1.2257 and low at 1.2130 showed a movement of 127 pips.

In the upcoming week we expect EUR/USD to show a bearish trend. The currency pair is trading below the 50 Simple Moving Average and the MACD trades to the downside. A solid breakout below 1.2131 may open a clean path towards 1.2067 and may take a way down to 1.2004. Should 1.2259 prove to be unreliable resistance, the EURUSD may raise upwards 1.2322 and 1.2386 respectively. Chart formation of a Symmetrical triangle pattern breakout in H4 chart sets prospects for a bearish trend. Hanging man pattern formation in H4 chart escalates the expectation for a bearish trend.

Preference
Sell: 1.2197 target at 1.2076 and stop loss at 1.2264


Alternate Scenario
Buy:  1.2264 target at 1.2385 and stop loss at 1.2197

USD/JPY Weekly Forecast (28th December 2020 – 01st January 2021)

Fundamental view:

US dollar seemed to be stronger against the yen in the previous week. US dollar is heavily weighed upon by the stimulus situation in America, which seems to be getting more aggressive as Donald Trump is demanding even more stimulus for Americans.

US New Home Sales on 23rd Dec and Japan Housing Starts yearly report on 25th Dec created a bearish environment for the pair whereas Japan BOJ Core CPI yearly report on 22nd Dec and Japan Tokyo Core CPI on 25th Dec created bullish environment for the pair.

The major economic events deciding the movement of the pair in the next week are US Dallas Fed Manufacturing Index at Dec 28, US S&P/CS HPI Composite-20 y/y at Dec 29, US Pending Home Sales monthly report, US EIA Crude Oil Stocks Change at Dec 30, and US Initial Jobless Claims at Dec 31.

USD/JPY Weekly outlook:

Technical View:

Last week’s high was 0.25% lower than the previous week. Maintaining high at 103.89 and low at 103.25 showed a movement of 64 pips.

In the upcoming week we expect USD/JPY to show a bullish trend. The currency pair is trading above the 50 Simple Moving Average and the MACD trades to the upside. A solid breakout above 103.87 may open a clean path towards 104.20 and may take a way up to 104.51. Should 103.23 prove to be unreliable support, the USDJPY may sink downwards 102.92 and 102.59 respectively. In H4 chart, Formation of Ascending triangle pattern breakout indicates reversal of the trend creating prospects of a bullish trend Along with a bullish engulfing formation braces our expectation.

Preference
Buy: 103.61 target at 104.19 and stop loss at 103.18


Alternate Scenario
Sell:  103.18 target at 102.61 and stop loss at 103.61

BTC/USD Weekly Forecast (28th December 2020 – 01st January 2021)

Fundamental view:

Bitcoin fell in the last week initially due to the positive sentiment for the greenback but it made a bounce back at the end of the week. Investors on social media platform declared a “Merry Bitmas. Bitcoin continues to be one of the market’s coronavirus winners; with investors optimistic it will continue to soar and even pose a threat to safe havens like gold.

Bitcoin is still growing leaps and bounds setting new highs every few days in its current price discovery phase. After setting a new all-time high on Christmas, the flagship crypto did not stop there. During the Asian hours on December 26, bitcoin surged and briefly surpassed the $25K mark. Currently, the market sentiment around bitcoin remains highly positive although there are some worries put forward by analysts in the foreseeable future.

The major economic events deciding the movement of the pair in the next week are Dallas Fed Manufacturing Index at Dec 28, S&P/CS HPI Composite-20 y/y at Dec 29, Pending Home Sales monthly report, EIA Crude Oil Stocks Change at Dec 30, and Initial Jobless Claims at Dec 31 for US.

BTC/USD Weekly outlook:

Technical View:

Last week’s high was 2.9% higher than the previous week. Maintaining high at 24980.1 and low at 21903.0 showed a movement of 3077 pips.

In the upcoming week we expect BTC/USD to show a bullish trend. The Instrument is trading above the 200 Simple Moving Average and the MACD trades to the upside. A solid breakout above 25759.3 may open a clean path towards 26908.3 and may take a way up to 28836.4. Should 22682.2 prove to be unreliable support, the BTCUSD may sink downwards 20754.1 and 19605.2 respectively. In H4 chart bullish gartley pattern favors prospects of a bullish trend. Bullish hammer pattern constructs a bullish outlook for the pair in the upcoming week.

Preference
Buy: 24325.2 target at 26907.3 and stop loss at 22678.4


Alternate Scenario
Sell: 22678.4 target at 20755.7 and stop loss at 24325.2

GBP/USD Weekly Forecast (28th December 2020 – 01st January 2021)

Fundamental view:

British pound traders have had a wild week initially but later in the week showed a bullish trend against greenback. Meanwhile Brexit is in its final hours of negotiation. Negotiation between the United Kingdom and the European Union is still going as arguing about fish is still on. United Kingdom is locking down its economy, and we have to eventually start focusing on the economy itself, as it certainly will not be pretty. US Richmond Manufacturing Index on 22nd Dec and US Core PCE Price Index monthly report & US Personal Income on 23rd Dec favored bullish atmosphere for the pair whereas Britain Public Sector Net Borrowing & Britain Current Account on 22nd Dec favors bearish atmosphere for the pair.

The major economic events deciding the movement of the pair in the next week are US Dallas Fed Manufacturing Index at Dec 28, UK Nationwide HPI yearly report, US S&P/CS HPI Composite-20 y/y at Dec 29, US Pending Home Sales monthly report, US EIA Crude Oil Stocks Change at Dec 30, US Initial Jobless Claims at Dec 31.

GBP/USD Weekly outlook:

Technical View:

Last week’s high was 0.04% lower than the previous week. Maintaining high at 1.3619 and low at 1.3188 showed a movement of 431 pips.

In the upcoming week we expect GBP/USD to show a bearish trend.  The currency pair is trading above the 200 Simple Moving Average and the MACD trades to the downside. A solid breakout below 1.3283 may open a clean path towards 1.3020 and may take a way down to 1.2852. Should 1.3714 prove to be unreliable resistance, the GBPUSD may raise upwards 1.3883 and 1.4146 respectively. Chart formation of bearish butterfly pattern in H4 chart favors prospects of a bearish trend. Spinning top pattern formation escalates the expectation for a bearish trend.

Preference
Sell: 1.3549 target at 1.3183 and stop loss at 1.3719


Alternate Scenario
Buy:  1.3719 target at 1.4145 and stop loss at 1.3549