Lockdown in UK pressurizes sterling

Heading into the Christmas-holiday shortened week, the concerns over the corona virus contagion have intensified, especially after a new covid strain was found in the UK. Italy announced late Sunday that it had confirmed a COVID-19 case in the country, which had the new variant detected in England.

UK PM Boris Johnson described the variant as up to 70% “more transmissible” and other UK authorities describe as “out of control”. British transport minister Grant Shapps urged Britons and particularly hauliers on Sunday not to travel to ports in Kent in southern England after France said it would bar those coming from Britain for 48 hours from Sunday night.

Earlier on Sunday, several European countries began closing their doors to travelers from Britain after the country tightened restrictions in London and southern England to try to curb the spread of a new strain of COVID-19.

“Following the French government’s announcement it will not accept any passengers arriving from the UK for the next 48hrs, we’re asking the public and particularly hauliers not to travel to Kent ports or other routes to France,” Shapps said on Twitter.

The travel restrictions come at a difficult time for many British companies, which are engaged in last-minute stockpiling before Dec. 31, when a status quo transition period with the European Union ends and new customs rules come into effect.

Adding to it, Scottish First Minister Nicola Sturgeon has asked the UK’s PM Boris Johnson to go against his Tory party’s wishes and seek a Brexit transition period extension. The request comes following further delays to any agreement with the EU on a Brexit deal where yet another penciled-in deadline has been moved.

GBP/USD 4 Hour Chart:

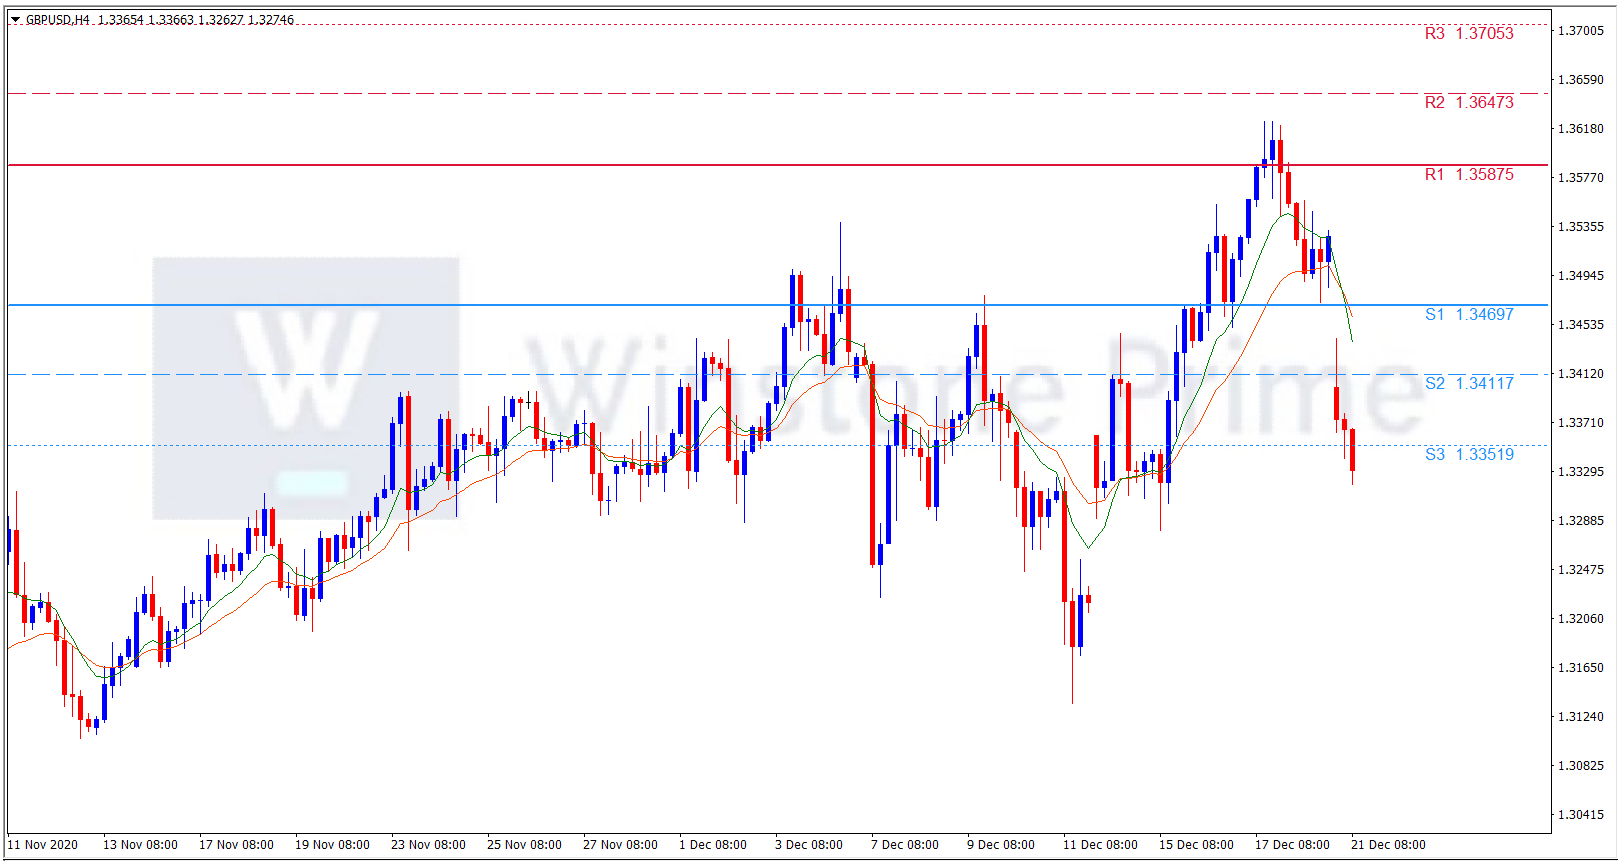
Support: 1.3470 (S1), 1.3412 (S2), 1.3352 (S3).

Resistance: 1.3588 (R1), 1.3647 (R2), 1.3705 (R3).

Cable has shown a expected drop with the prevailing catalyst, we expect a bearish trend for GBP/USD.

The Importance of the US Dollar Index

One of the most important barometers for global currencies is the Dollar Index (DXY), which measures the value of the US Dollar versus a basket of global currencies. It began at an arbitrary 100.000 in March of 1973.  The basket of currencies essentially consists of nations that have significant trading relationship with the US and are also hard floating currencies. 

The dollar is the most traded currency in the world and an indicator of the relative strength of the US dollar around the world. There are many reasons for the importance of the US dollar. First, most commodities in the world are denominated in US dollars. Second, by comparison, key macro parameters such as market cap, foreign exchange reserves and GDP are compared across countries in US dollars.  Keep reading to learn more on the US Dollar Index, how it is calculated, and what affects it price.

How are these currencies weighted?

US dollar index, also known as the DXY, is a quick measure of the value of the US dollar against the weighted basket of US trading partners. Launched by the US Federal Reserve in 1973, the DXY is a popular base for valuing and trading the dollar. The 6 coins in the basket include the Euro, Japanese Yen, Pound Sterling, Canadian Dollar, Swedish Krone and Swiss Franc. 

In terms of weighting, the Euro (EUR) controls the largest percentage share at approximately 57.6%. This is followed by the Japanese yen (JPY) at 13.7%, the British pound (GBP) at 11.9%, the Canadian dollar (CAD) at 9.1%, the Swedish Krona (SEK) at 4.2% and the Swiss franc (CHF) at 3.6%.

Since the euro is the second-leading reserve currency, it has the highest weighting in the dollar index.

The dollar index is calculated according to the following formula of currency pairs:

USDX = 50.14348112 × EURUSD -0.576 × USDJPY 0.136 × GBPUSD -0.119 × USDCAD 0.091 × USDSEK 0.042 × USDCHF 0.036

The Dollar Index measures the strength of the US$ versus this 6-currency basket. If the dollar strengthens against these currencies the index will rise and if it weakens it will fall.

Brief History of the U.S. Dollar Index began at a baseline value of 100 in March 1973, shortly after the Bretton Woods Agreement was dissolved. From your high school history class, you will recall that the Bretton Woods Agreement established a new international monetary system, the Bretton Woods System in 1944. The Bretton Woods Agreement also established the International Monetary Fund and the World Bank. Under the Bretton Woods System, gold was the basis for the U.S. dollar and other currencies were then pegged to the U.S. dollar’s value. The Bretton Woods System ended when President Nixon announced that the U.S. would no longer exchange gold for U.S. currency. The basket was altered in 1999 when the Euro replaced several European currencies. It still includes the Swedish Krona and the Swiss Franc even though we trade more heavily with countries like China, Mexico and South Korea. Since then, it has been as high as 164.72 (February 1985) and as low as 71.58 (April 2008). It’s reached On 2016 Brexit referendum takes place in the United Kingdom; Donald Trump elected president and it has reached on 102.21 and got a first dip as 89.21  since 2018 the reason behind is Increased pandemic stimulus payment prospects after Democrats take Senate control in the Georgia runoff election.

Reason behind US Dollar Index moment

The price of the USDX is moved by macroeconomic events and data, such as GDP economic growth, the economic health of each country, and the monetary and fiscal policies of each central bank.

Another large influence on the US Dollar index’s price is safe haven inflows. The index can rise during periods of uncertainty if traders regard the US dollar as a value store amid global economic crises. The index can fall if risk-on sentiment dominates and investors sell off USD and move into riskier assets.

Why it is important for traders

Investors are keeping an eye on the U.S. Dollar Index as it allows them to monitor the value of the Greenback compared to a basket of major currencies. If a trader is convinced the US Dollar will appreciate across the board, it might be simpler to place a single trade betting on a rising US Dollar Index instead of having to manage multiple forex positions. Some market participants also use the US Dollar Index for hedging purposes. Find out more on how to trade indices to benefit from USDX price movement.

US Index on Pandemic Situation

Coronavirus Impact Most recently, COVID-19 has driven investors to the perceived safety of the U.S. dollar and it has risen markedly since March. In fact, the USD is trading at its highest level since April 2017. In other words, the strengthening U.S. dollar now buys more of the other currencies than it did before. Even though market pundits might suggest that a strong dollar is tied to a strong economy, the reality is that’s not accurate. While it’s complicated, generally speaking a strong USD can be a negative for companies with a significant international business, as a strong USD makes those U.S. goods more expensive abroad. President Trump summarized the challenge that a strong USD can bring when he said a strong dollar is “a beautiful thing in one way, but it makes it harder to compete.” By contrast, a weaker USD would allow U.S. manufacturers to sell more of their products overseas, as their goods become cheaper. But that also means that the American consumer would see prices of goods from overseas companies rise. One more benefit of a strong USD: it makes travelling to foreign countries cheaper for Americans, but more expensive for tourists from other countries visiting the U.S. But since global travel has come to a screeching halt, that’s like having a 100-trillion Zimbabwean dollar note worth about 40 U.S. cents.

Conclusion

The Dollar being the central currency for global trade and commerce becomes an important barometer for global economies. Even for the other currencies, there is an exact relationship between the dollar index (DXY) and the strength of the other pair. However, if a trader plans to use the US Dollar Index to bet on the direction of the Dollar, they must always be mindful of the basket and the weightings. The US Dollar Index can be traded using futures and options or, where permitted, spread betting and CFD trading can also be used to speculate on whether the USDX will go up or down in price.

AUD/USD Weekly Forecast (21st December 2020 – 25th December 2020)

Fundamental view:

AUD has rallied against greenback in the past week. Upbeat Australian employment data and a dovish US Federal Reserve triggered the bullish breakout. The American currency plunged on a risk-on mood and a dovish Fed, as speculative interest was optimistic over a Brexit deal and the US stimulus package. Both suffered delays and are still to be resolved, yet market players are confident they’ll be resolved in the upcoming days. Regarding Brexit, there are still substantial differences in fisheries, but negotiations will continue over the weekend. 

In the previous week, US Capacity Utilization Rate & US Industrial Production monthly report on 15th December and US Building Permits on 17th December created bearish atmosphere whereas US TIC Long-Term Purchases & US Flash Services PMI on 16th December and Australia Employment Change & Unemployment Rate on 17th December created bullish atmosphere for the pair.

The major economic events deciding the movement of the pair in the next week are Australia Retail Sales monthly report, US GDP quarterly report, US CB Consumer Confidence Index at Dec 22, RBA Private Sector Credit monthly report at Dec 23, US Core Durable Goods Orders monthly report, and US Initial Jobless Claims at Dec 24.

AUD/USD Weekly outlook:

Technical View:

Last week’s high was 0.89% higher than the previous week. Maintaining high at 0.7640 and low at 0.7507 showed a movement of 133 pips.

In the upcoming week we expect AUD/USD to show a bullish trend.  The currency pair is trading above the 200 Simple Moving Average and the MACD trades to the upside. A solid breakout above 0.7671 may open a clean path towards 0.7721 and may take a way up to 0.7803. Should 0.7539 prove to be unreliable support, the AUDUSD may sink downwards 0.7457 and 0.7406 respectively. In H4 chart symmetrical triangle breakout favors prospects of a bullish trend. Also to be noted bullish hammer formation exerts the expectation of uptrend for the pair.

Preference
Buy:  0.7616 target at 0.7719 and stop loss at 0.7534


Alternate Scenario
Sell: 0.7534 target at 0.7407 and stop loss at 0.7616

EUR/USD Weekly Forecast (21st December 2020 – 25th December 2020)

Fundamental view:

The Euro rallied during the week. The greenback was pressured by an optimistic mood related to Brexit talks and a US coronavirus relief package. The week went by and both issues remain unsolved, although investors are still waiting for positive news in the next couple of days.

In the past week, US Capacity Utilization Rate & Industrial Production monthly report created bearish atmosphere whereas US Core Retail Sales monthly report & Retail Sales monthly report on 16th December and Europe Belgian NBB Business Climate & US CB Leading Index monthly report on 18th December created a bullish atmosphere for the pair.

The major economic events deciding the movement of the pair in the next week are Euro GfK Consumer Climate, US GDP quarterly report, US CB Consumer Confidence Index at Dec 22, Euro GDP quarterly report at Dec 23, US Core Durable Goods Orders monthly report, and US Initial Jobless Claims at Dec 24.  

EUR/USD Weekly outlook:

Technical View:

Last week’s high was 0.88% higher than the previous week. Maintaining high at 1.2273 and low at 1.2116 showed a movement of 157 pips.

In the upcoming week we expect EUR/USD to show a bullish trend. The currency pair is trading above the 200 Simple Moving Average and the MACD trades to the upside. A solid breakout above 1.2313 may open a clean path towards 1.2372 and may take a way up to 1.2470. Should 1.2156 prove to be unreliable support, the EURUSD may sink downwards 1.2057 and 1.1999 respectively. Chart formation of a bullish shark pattern in H4 chart creates prospects for a bullish trend. Spinning top formation in H4 chart escalates the expectation for a bullish trend.

Preference
Buy:  1.2231 target at 1.2371 and stop loss at 1.2151


Alternate Scenario
Sell: 1.2151 target at 1.2002 and stop loss at 1.2231