GBP/USD Weekly Forecast (21st December 2020 – 25th December 2020)

Fundamental view:

The British pound has rallied to break above the 1.35 level during the week. The EU and the UK leveled up the pound with Level-Playing Field progress – and now it is down to fish to seal a Brexit deal. Apart from the incessant noise of headlines from the talks, investors may have time to take stock of a turbulent end to 2020 in the short holiday week. Comments from the talks in Brussels and from officials in London have generally moved in a positive direction which helped the pound.

During the week, US Building Permits on 17th December and US Current Account & US CB Leading Index monthly report created bearish atmosphere whereas Britain Unemployment  on 15th December and US TIC Long-Term Purchases on 16th December favors bullish environment for the pair.

The major economic events deciding the movement of the pair in the next week are UK GDP quarterly report, UK Business Investment quarterly report, US GDP quarterly report, US CB Consumer Confidence Index at Dec 22, US Core Durable Goods Orders monthly report, and US Initial Jobless Claims at Dec 24.

GBP/USD Weekly outlook:

Technical View:

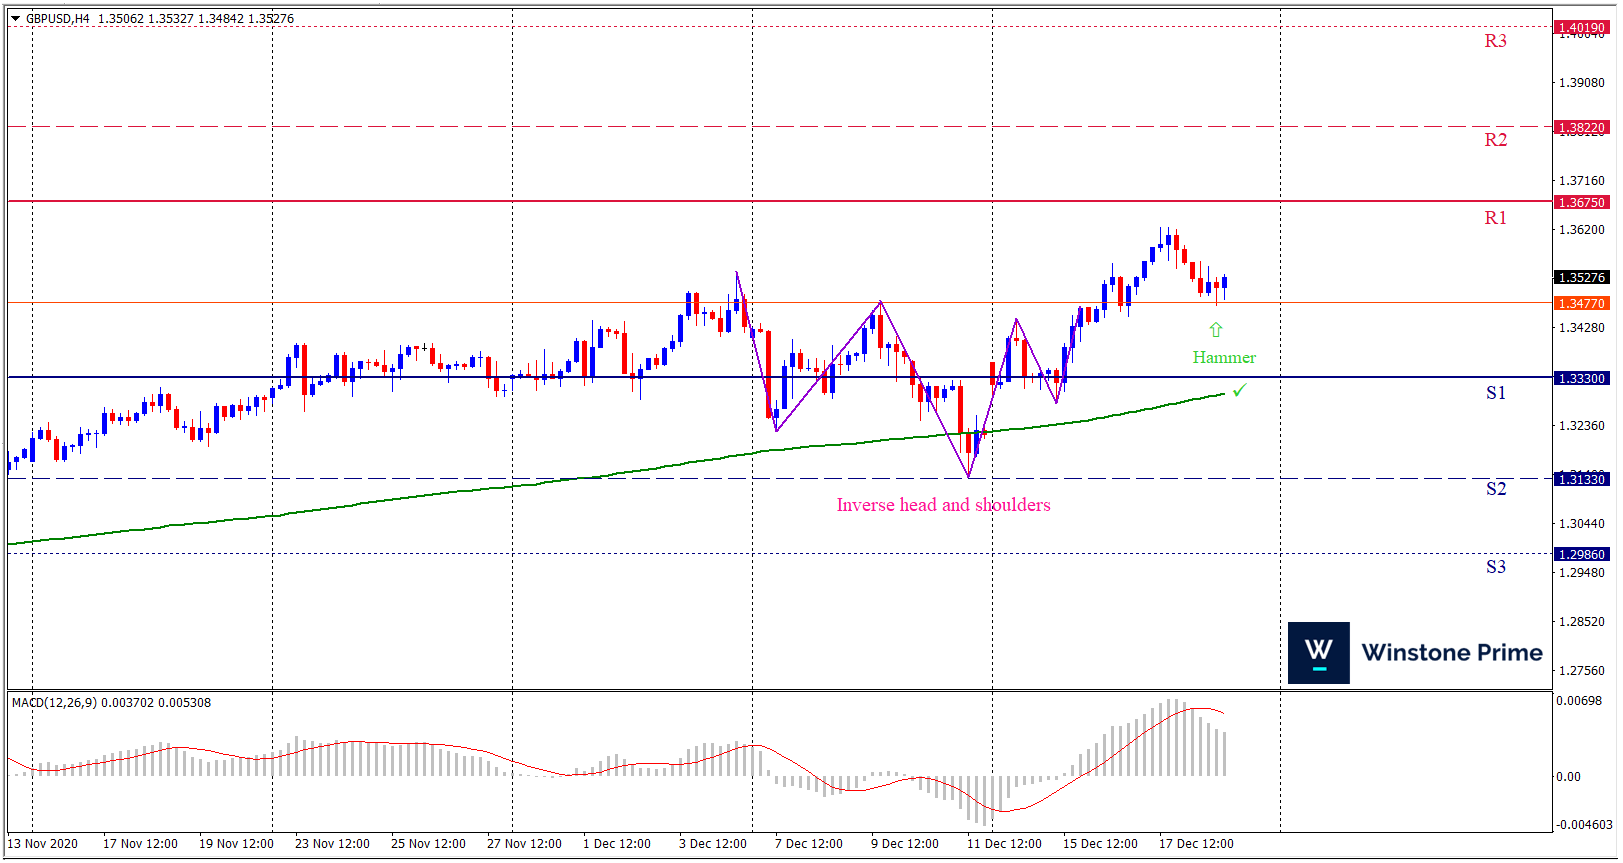
Last week’s high was 1.09% higher than the previous week. Maintaining high at 1.3625 and low at 1.3280 showed a movement of 345 pips.

In the upcoming week we expect GBP/USD to show a bullish trend.  The currency pair is trading above the 200 Simple Moving Average and the MACD trades to the downside. A solid breakout above 1.3675 may open a clean path towards 1.3822 and may take a way up to 1.4019. Should 1.3330 prove to be unreliable support, the GBPUSD may sink downwards 1.3133 and 1.2986 respectively. Chart formation of inverse head and shoulders pattern in H4 chart creates prospects of a bullish trend. Hammer pattern formation escalates the expectation for a bullish trend.

Preference
Buy:  1.3476 target at 1.3801 and stop loss at 1.3325


Alternate Scenario
Sell: 1.3325 target at 1.2977 and stop loss at 1.3476

BTC/USD Weekly Forecast (21st December 2020 – 25th December 2020)

Fundamental view:

It’s been a momentous week for Bitcoin. Since the beginning of October, the coin’s value more than doubled; those who were wise enough to buy some BTC in the middle of March got away with 500% returns on their investments. Bitcoin made several approaches to $20,000 and finally smashed it amid substantial market volume. The fundamental reasons for the growth remained the same for a while: inflationary pressure, low-interest environment, growing institutional interest – the catalysts for the breakup. However, a massive flow of evidence that Bitcoin is swiftly turning into a mainstream asset created a new wave of demand and pushed the price above the critical level.

According to Dave Weisberger, the co-founder of and CEO of CoinRoutes, a U.S. cryptocurrency software firm, investors buy Bitcoin in hopes that someday it would be the equivalent of gold. And this is something that may become a self-sustained prophecy.

The major economic events deciding the movement of the pair in the next week are GDP quarterly report, CB Consumer Confidence Index at Dec 22, New Home Sales, EIA Crude Oil Stocks Change at Dec 23, Core Durable Goods Orders monthly report, and Initial Jobless Claims at Dec 24 for US.

BTC/USD Weekly outlook:

Technical View:

Last week’s high was 22.22% higher than the previous week. Maintaining high at 23711.3 and low at 18943.1 showed a movement of 4768 pips.

In the upcoming week we expect BTC/USD to show a bullish trend. The Instrument is trading above the 200 Simple Moving Average and the MACD trades to the upside. A solid breakout above 24796.9 may open a clean path towards 26638.2 and may take a way up to 29565.1. Should 20028.6 prove to be unreliable support, the BTCUSD may sink downwards 17101.7 and 15260.4 respectively. In H4 chart pennant pattern breakout favors prospects of a bullish trend. Bullish harami pattern constructs a bullish outlook for the pair in the upcoming week.

Preference
Buy: 23035.7 target at 26637.5 and stop loss at 20023.4


Alternate Scenario
Sell: 20023.4 target at 15265.8 and stop loss at 23035.7

USD/JPY Weekly Forecast (21st December 2020 – 25th December 2020)

Fundamental view:

The USD/JPY pair fell to a fresh monthly low of 103.25 this week as the greenback plummeted on the back of the market’s hopes. The pair neared June 2020 low at 103.17, bouncing ahead of the Fed’s announcement, as poor US data dented investors’ mood. The Bank of Japan’s decisions to leave interest rates and yield-curve control policy unchanged were expected. Overall the pair showed a bearish move.

In the past week, US Flash Manufacturing PMI on 16th December and US Building Permits  on 17th December favors uptrend whereas Japan Tankan Manufacturing Index & Japan Revised Industrial Production monthly report on 14th December and  US TIC Long-Term Purchases on 16th December favors downtrend for the pair.

The major economic events deciding the movement of the pair in the next week are BoJ Monetary Policy Meeting Minutes, US GDP quarterly report, US CB Consumer Confidence Index at Dec 22, Japan Unemployment Rate, US Core Durable Goods Orders monthly report, and US Initial Jobless Claims at Dec 24.

USD/JPY Weekly outlook:

Technical View:

Last week’s high was 0.40% lower than the previous week. Maintaining high at 104.15 and low at 102.87 showed a movement of 128 pips.

In the upcoming week we expect USD/JPY to show a bearish trend. The currency pair is trading below the 200 Simple Moving Average and the MACD trades to the downside. A solid breakout below 102.72 may open a clean path towards 102.16 and may take a way down to 101.44. Should 103.99 prove to be unreliable resistance, the USDJPY may raise upwards 104.71 and 105.27 respectively.  In H4 chart, Formation of bearish 5-D pattern indicates reversal of the trend creating prospects of a bearish trend Along with a bearish spinning top formation braces our expectation.

Preference
Sell:  103.40 target at 102.27 and stop loss at 104.05


Alternate Scenario
Buy: 104.05 target at 105.26 and stop loss at 103.40

XAU/USD Weekly Forecast (21st December 2020 – 25th December 2020)

Fundamental view:

Gold has rallied again during the week. And a plenty of momentum is seen in the yellow metal.

The coronavirus vaccine rollout, Brexit optimism and heightened hopes for a US stimulus bill caused risk flows to dominate the financial markets and continued to hurt the greenback. Mirroring the broad-based USD weakness, the US Dollar Index, which tracks the buck’s performance against a basket of six major currencies, broke below 90 for the first time since April 2018. US Federal Reserve’s dovish policy outlook put additional weight on the USD’s shoulders toward the end of the week. Following its last meeting of 2020, the FOMC left its policy settings unchanged as expected. During the press conference, FOMC Chairman Jerome Powell said that they remain open to increasing the size of asset purchases if required. Additionally, Powell reaffirmed that the Fed will not hesitate to do more if needed by using all of its tools available.

The major economic events deciding the movement of the pair in the next week are GDP quarterly report, CB Consumer Confidence Index at Dec 22, New Home Sales, EIA Crude Oil Stocks Change at Dec 23, Core Durable Goods Orders monthly report, and Initial Jobless Claims at Dec 24 for US.

XAU/USD Weekly outlook:

Technical View:

Last week’s high was 1.12% higher than the previous week. Maintaining high at 1896.3 and low at 1819.1 showed a movement of 772 pips.

In the upcoming week we expect XAU/USD to show a bullish trend.  The Instrument is trading above the 200 Simple Moving Average and the MACD trades to the upside. A solid breakout above 1912.0 may open a clean path towards 1942.7 and may take a way up to 1898.2. Should 1834.8 prove to be unreliable support, the XAUUSD may sink downwards 1788.4 and 1757.6 respectively.  In H4 chart Ascending Triangle breakout favors prospects of a bullish trend. Also to be noted bullish harami pattern formation exerts the expectation of uptrend for the pair.

Preference
Buy: 1875.2 target at 1941.7 and stop loss at 1829.9


Alternate Scenario
Sell:  1829.9 target at 1758.6 and stop loss at 1875.2