BOJ efforts fail to impact yen

The Bank of Japan (BOJ) left its monetary policy setting unchanged after concluding its two-day September monetary policy review meeting on Friday. The central bank left the key rate steady at -10bps while maintaining a 10yr JGB yield target at 0.00%.

Japan’s government raised the FY2021 GDP estimate +4.0% from the previous forecast of +3.4% in July amid stimulus optimism, the latest estimate by the Cabinet Office showed on Friday.

The forecast 4.0% growth for next fiscal year would be the fastest annual expansion on record, if realized, since comparable data became available in 1995.

As per a report, Policymakers need to keep a close watch “on downside risks to the economy in Japan and overseas from the pandemic and impacts from moves in financial capital markets.”“Overall consumer prices are forecast to fall 0.6% for this fiscal year, from a 0.3% decline expected previously.“

“In fiscal 2021, overall prices will grow 0.4%, the government said, revised down slightly from the previous forecast of a 0.5% increase.”“For the current fiscal year that ends in March 2021, the government cut its gross domestic product forecast to a 5.2% contraction, which would be the biggest annual slump on record.”

On the other hand, Japanese shares inched lower on Friday as investors fretted over the risks that surging COVID-19 cases in Tokyo could pose to recovery prospects in the world’s third-largest economy. The Nikkei share average .N225 lost 0.19% to 26,756.89 by the midday break, while the broader Topix. TOPX was nearly flat at 1,791.84 ahead of a central bank policy decision. Both the indexes, however, were on track to post weekly gains.

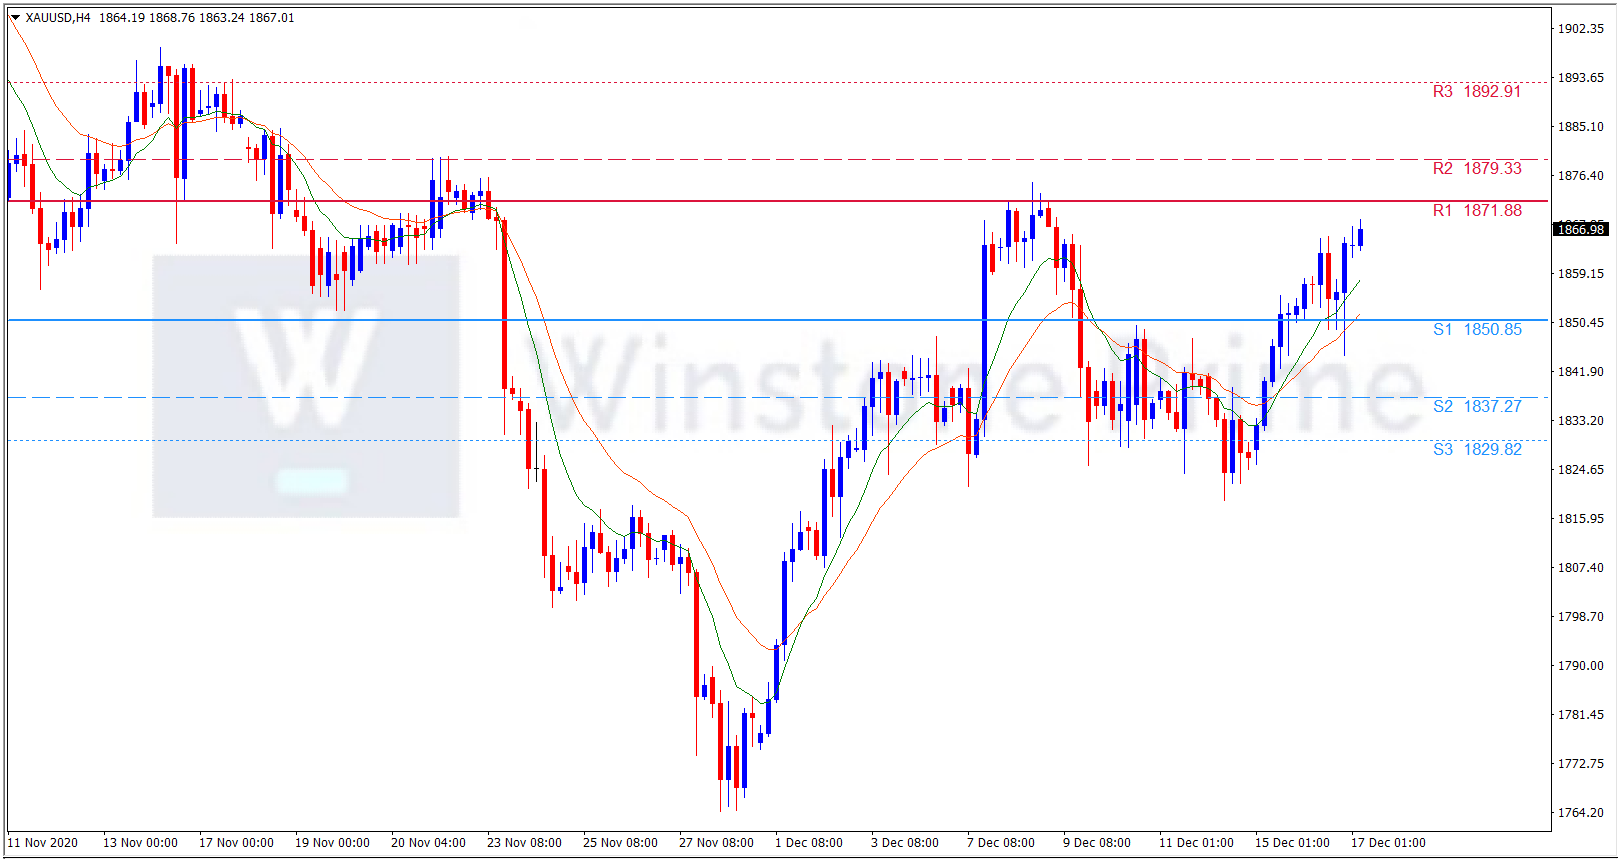
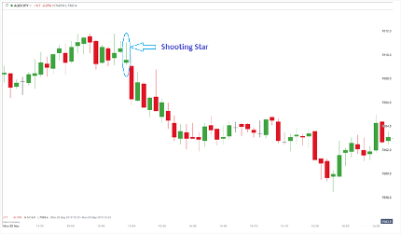
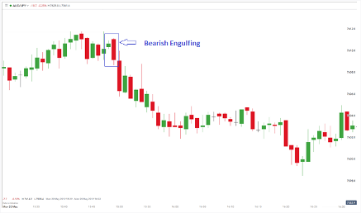
USD/JPY 4 Hour Chart:

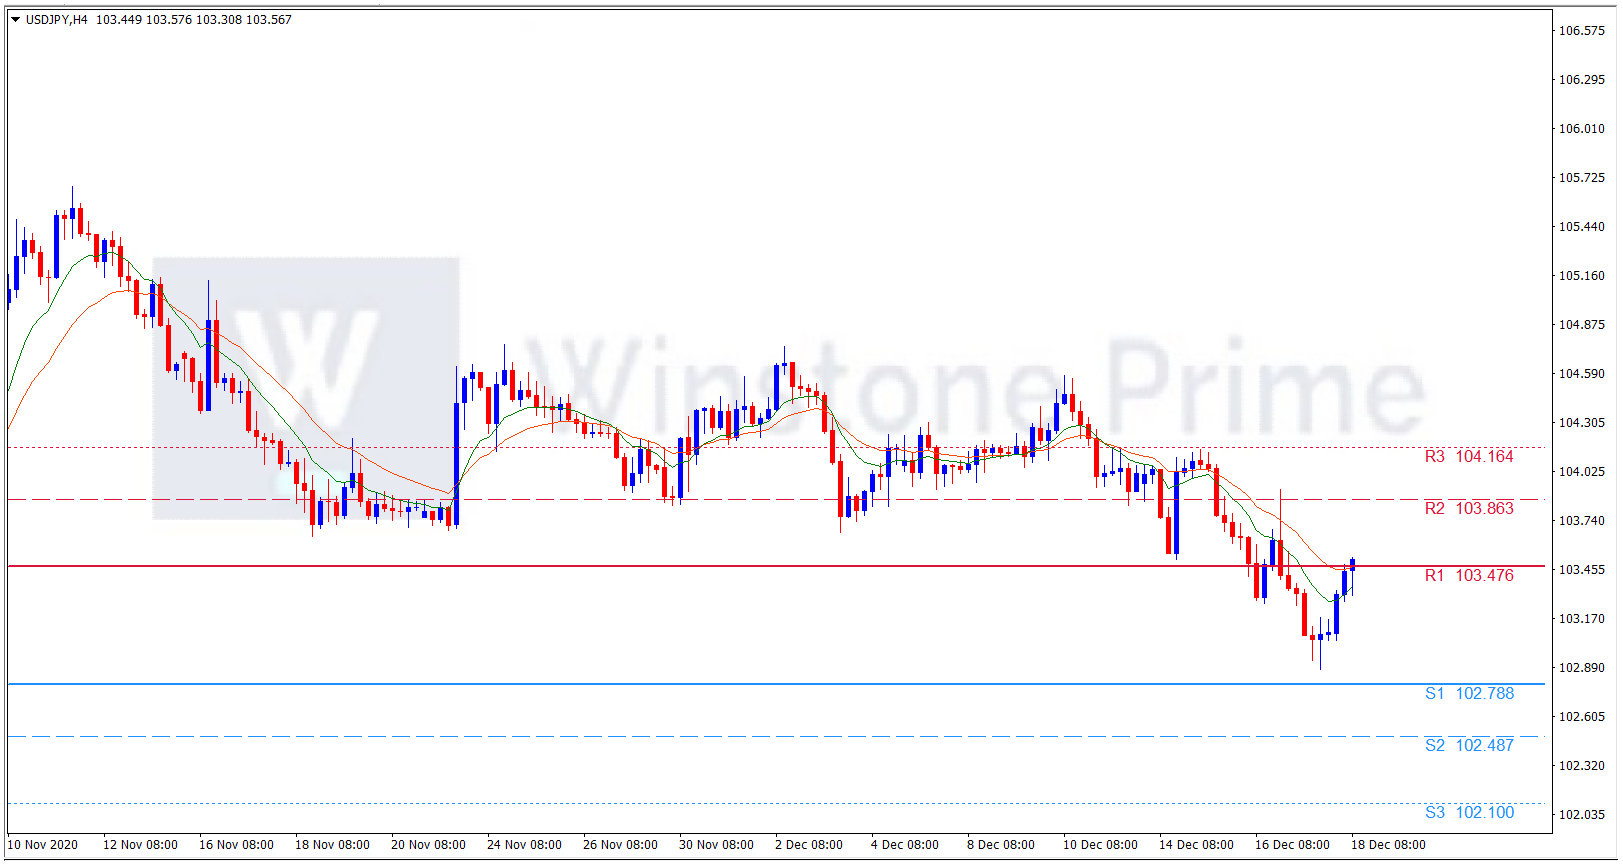
Support: 102.79 (S1), 102.49 (S2), 102.10 (S3).

Resistance: 103.48 (R1), 103.86 (R2), 104.16 (R3).

In the prevailing atmosphere which is weak for yen against greenback, we expect a bullish atmosphere for USD/JPY.

Progress on Fiscal stimulus weighs on greenback

Gold held firm near a one-week high on Thursday as progress on a U.S. fiscal stimulus deal weighed on the dollar, while a pledge by the Federal Reserve to keep rates low until an economic recovery is secure lent further support.U.S. congressional negotiators haggled on Wednesday over details of a $900 billion COVID-19 aid bill that is expected to include $600-$700 stimulus checks and extended unemployment benefits, causing the dollar to languish near a more than two-year trough.

The Goldman Sachs analysts offer their take on Wednesday’s FOMC decision, where the Fed pledged to maintain bond buys until the economy sees ‘substantial’ gains.

The key notes of the FOMC decision are “FOMC left the funds rate target range unchanged at 0-0 25%. “Provided new guidance on the timeline for tapering asset purchases by announcing that it will continue to increase its asset holdings at the current rate “until substantial further progress has been made toward the Committee’s maximum employment and price stability goals.”

“FOMC did not announce charges to the maturity composition of its asset purchases.”“However, the dot plot showed only one additional participant (five total. vs. our expectation of six projecting a rate hike by 2023. “

On the other hand, The United States and Europe should agree to cooperate in opposing any future “hurtful” subsidies used by China to build up its commercial aircraft industry, U.S. Trade Representative Robert Lighthizer told.Lighthizer said he was working to settle a 16-year-old dispute between Washington and Brussels over past government aid to aircraft manufacturers, but expressed frustration that current World Trade Organization rules would not prevent future subsidies by the European Union or China.

“If this plays out, they can start a new subsidy tomorrow, and drag out that litigation for five or six years, and there’s nothing under the WTO that you can do about it at all,” Lighthizer said in a rare interview late on Tuesday. He also said that he had made several proposals to settle the matter before the Trump administration leaves office on Jan. 20.

XAU/USD 4 Hour Chart:

Support: 1850.9 (S1), 1837.3 (S2), 1829.8 (S3).

Resistance: 1871.9 (R1), 1879.3 (R2), 1892.9 (R3).

Amidst all the catalysts weakening the dollar, we expect a bullish trend for XAU/USD.

CPI expectation favors Sterling

The cost of living in the UK as represented by the Consumer Price Index (CPI) for November month is due early on Wednesday at 07:00 GMT. The key inflation data will join the current Brexit drama, the coronavirus (COVID-19) vaccine headlines and the US covid stimulus updates to entertain the Pound traders. The price economics gain more importance ahead of Thursday’s Bank of England meeting.

The headline CPI inflation is expected to ease from 0.7% prior to 0.6% on an annual basis. The Core CPI that excludes volatile food and energy items is also likely to recede from 1.5% to 1.4% YoY. Talking about the monthly figures, the CPI bears the upbeat consensus of +0.1% versus +0.0% prior.

According to a tweet by MNI’s Anthony Barton, the investment banking giant Morgan Stanley believes the UK and European Union (EU) have moved closer to a Canada-style Brexit trade deal. “The recent Brexit-related news flow suggests that Britain and the European Union have found a way forward on the level playing field (LPF). We again confidently expect a Canada-style deal, and see just a 20% chance of the talks breaking down & a WTO outcome,” Morgan Stanley said.

US Senate Majority Leader Mitch McConnell joins House Speaker Nancy Pelosi and Treasury Secretary Steve Mnuchin to discuss the much-awaited US aid package. Recent updates suggest that the policymakers are closer to a deal after only two issues left pending for the finalization during the previous talks.

On the other hand, Ireland’s new Taoiseach (Irish Prime Minister) Micheal Martin recently suggested that further clarity over the Brexit deal is expected by the weekend. It should, however, be noted that the Daily Telegraph Reporter Harry Yorke tweeted that he was told Boris Johnson has sent a message of reassurance to the ERG this evening: “Never fear folks we will vindicate the people in full or else as I have said many times we will start the new year World Trade Organizations (WTO) terms!”

GBP/USD 4 Hour Chart:

Support: 1.3341 (S1), 1.3216 (S2), 1.3152 (S3).

Resistance: 1.3530 (R1), 1.3595 (R2), 1.3720 (R3).

If today’s UK CPI manage to beat the market consensus on a positive side then it will immediate strength to GBP/USD. We expect a bullish trend for GBP/USD.

Candlestick Analysis

A Candlestick is a type of a price chart that displays the open, high, low and close of specific security for a given time period.

The vertical rectangle of the candlestick represents the real body and can be used to identify if the closing price was higher or lower than the opening price.

Generally, green is used to represent a bullish pattern meaning the closing price of the stock was higher than the opening price and red is used to represent a bearish pattern meaning the closing price was lower than the opening price. Here is a pictorial representation of the same below:

Trend: Neutral 

A spinning top is a candlestick pattern with a short real body that’s vertically centered between long upper and lower shadows. The candlestick pattern represents indecision about the future direction of the asset. Neither the buyers nor the sellers could gain the upper hand. The buyers pushed the price up during the period, and the sellers pushed the price down during the period, but ultimately the closing price ended up very close to the open. After a strong price advance or decline, spinning tops can signal a potential price reversal, if the candle that follows confirms.

Find the Bearish and Bullish candlestick chart below:

Bullish spinning chart

Bearish spinning chart

Trend: Neutral       

In doji candlestick, there is no body is almost have same opening & closing price near the opening price and can have long shadows formed for the high and low prices, which were tested but fought back from by each side.

A Doji candle is the name given to patterns which signify indecision in the price action of a chart.

Usually, they form at areas where the bulls and bears commence battle and are fighting each other for direction.

This pattern signifies uncertainty, indecision, and is waiting for either the bulls or bears to take control. Often the next direction is an upwards or downwards sustained move in price as the Chart breaks beyond the Doji candle.

Although the Doji candle is often not a great entry candle for a trade (due to its nature it could be broken either way by the bulls or bears), it does offer a heads up that sentiment may be changing.

Find the Doji candlestick chart below:

Standard &Long legged Doji Chart

Marubozu means there are no shadows from the bodies.

Trend: Bullish

White Marubozu contains a long white body with no shadows. The open price equals the low price and the close price equals the high price.

This is a very bullish candle as it shows that buyers were in control the entire session. It usually becomes the first part of a bullish continuation or a bullish reversal pattern.

Trend: Bearish

Black Marubozu contains a long black body with no shadows. The open equals the high and the close equals the low.

This is a very bearish candle as it shows that sellers controlled the price action the entire session. It usually implies bearish continuation or bearish reversal.

Find the Bearish and Bullish candlestick chart below:

Bearish Marubozu Chart

Trend: Bullish

The hammer is a bullish reversal pattern that forms during a downtrend. It is named because the market is hammering out a bottom. When price is falling, hammers signal that the bottom is near and price will start rising again. The long lower shadow indicates that sellers pushed prices lower, but buyers were able to overcome this selling pressure and closed near the open.Just because you see a hammer form in a downtrend doesn’t mean you automatically place a buy order! More bullish confirmation is needed before it’s safe to pull the trigger.

Recognition Criteria for Hammer:

  • The long shadow is about two or three times of the real body.
  • Little or no upper shadow.
  • The real body is at the upper end of the trading range.
  • The color of the real body is not important.

Find the Bullish candlestick chart below:

Trend: Bearish

The hanging man is a bearish reversal pattern that can also mark a top or strong resistance level. When price is rising, the formation of a hanging man indicates that sellers are beginning to outnumber buyers. The long lower shadow shows that sellers pushed prices lower during the session. Buyers were able to push the price back up some but only near the open. This should set off alarms since this tells us that there are no buyers left to provide the necessary momentum to keep raising the price.

Recognition Criteria Hanging Man:

  • A long lower shadow which is about two or three times of the real body.
  • Little or no upper shadow.
  • The real body is at the upper end of the trading range.
  • The color of the body is not important, though a black body is more bearish than a white body.

Find the Bullish candlestick chart below:

Trend: Bullish

An inverted hammer is a bullish reversal candlestick. The inverted hammer occurs when price has been falling suggests the possibility of a reversal. Its long upper shadow shows that buyers tried to bid the price higher.

Find the Bullish candlestick chart below:

Trend: Bearish

The shooting star is a bearish reversal pattern that looks identical to the inverted hammer but occurs when price has been rising. Its shape indicates that the price opened at its low, rallied, but pulled back to the bottom. This means that buyers attempted to push the price up, but sellers came in and overpowered them. This is a definite bearish sign since there are no more buyers left because they’ve all been murdered.

Find the Bearish candlestick chart below:

Trend: Bullish

The bullish engulfing pattern is a two-candlestick pattern that signals a strong up move may be coming. It happens when a bearish candle is immediately followed by a larger bullish candle. This second candle “engulfs” the bearish candle. This means buyers are flexing their muscles and that there could be a strong up move after a recent downtrend or a period of consolidation.

Find the Bullish candlestick chart below

Trend: Bearish

The bearish engulfing pattern is the opposite of the bullish pattern. This type of candlestick pattern occurs when the bullish candle is immediately followed by a bearish candle that completely “engulfs” it. This means that sellers overpowered the buyers and that a strong move down could happen.

Find the Bearish candlestick chart below:

Trend: Bearish

The tweezers are dual candlestick reversal patterns.

The Tweezer Tops candlestick pattern are usually be spotted after an extended uptrend, indicating that a reversal will soon occur.

The Tweezer Tops is opposite the overall trend. If price is moving up, then the second candle should be bearish.

Find the Bearish candlestick chart below:

Trend: Bullish

The tweezers are dual candlestick reversal patterns.

The Tweezer Bottoms candlestick pattern are usually be spotted after an extended downtrend, indicating that a reversal will soon occur.

The Tweezer Bottoms candlestick is the same as the overall trend. If price is moving up, then the first candle should be bullish.

Find the Bullish candlestick chart below:

Trend: Bullish

The morning star is triple candlestick patterns that you can usually find at the end of a trend.They are reversal patterns that can be recognized through three characteristics.

We’ll use the morning star Pattern on the right as an example of what you may see:

  • The first candlestick is a bearish candle, which is part of a recent downtrend.
  • The second candle has a small body, indicating that there could be some indecision in the market. This candle can be either bullish or bearish.
  • The third candlestick acts as a confirmation that a reversal is in place, as the candle closes beyond the midpoint of the first candle.

Find the Bullish candlestick chart below:

Trend: Bearish

The Evening Star is triple candlestick patterns that you can usually find at the end of a trend. They are reversal patterns that can be recognized through three characteristics.

We’ll use the Evening StarPattern on the right as an example of what you may see:

  • The first candlestick is a bullish candle, which is part of a recent uptrend.
  • The second candle has a small body, indicating that there could be some indecision in the market. This candle can be either bullish or bearish.
  • The third candlestick acts as a confirmation that a reversal is in place, as the candle closes beyond the midpoint of the first candle.

Find the Bearish candlestick chart below:

Trend: Bullish

This type of triple candlestick pattern is considered as one of the most potent in-yo-face bullish signals, especially when it occurs after an extended downtrend and a short period of consolidation.

The first of the three soldiers is called the reversal candle. It either ends the downtrend or implies that the period of consolidation that followed the downtrend is over.

For the pattern to be considered valid, the second candlestick should be bigger than the previous candle’s body.

Also, the second candlestick should close near its high, leaving a small or non-existent upper wick.

For the three white soldiers pattern to be completed, the last candlestick should be at least the same size as the second candle and have a small or no shadow.

Find the Bullish candlestick chart below:

Trend: Bearish

The three black crows candlestick pattern is just the opposite of the three white soldiers. It is formed when three bearish candles follow a strong UPTREND, indicating that a reversal is in the works.

The second candle’s body should be bigger than the first candle and should close at or very near its low.

Finally, the third candle should be the same size or larger than the second candle’s body with a very short or no lower shadow.

Find the Bearish candlestick chart below:

Trend: Bullish

The three inside up candlestick formation is a trend-reversal pattern that is found at the bottom of a DOWNTREND.

This triple candlestick pattern indicates that the downtrend is possibly over and that a new uptrend has started.

For a valid three inside up candlestick formation, look for these properties:

  • The first candle should be found at the bottom of a downtrend and is characterized by a long bearish candlestick.
  • The second candle should at least make it up all the way up to the midpoint of the first candle.
  • The third candlestick needs to close above the first candle’s high to confirm that buyers have overpowered the strength of the downtrend.

Find the Bullish candlestick chart below:

Trend: Bearish

The three inside down candlestick formation is found at the top of an UPTREND. It means that the uptrend is possibly over and that a new downtrend has started. 

A three inside down candlestick formation needs to have the following characteristics:

  • The first candle should be found at the top of an uptrend and is characterized by a long bullish candlestick.
  • The second candle should make it up all the way down the midpoint of the first candle.
  • The third candlestick needs to close below the first candle’s low to confirm that sellers have overpowered the strength of the uptrend.

Find the Bearish candlestick chart below: