BTC/USD Weekly Forecast (14th December 2020 – 18th December 2020)

Fundamental view:

Bitcoin has reversed all the gains from the previous week and retreated below $18,000 amid the deepest weekly decline since the end of August. Although the cryptocurrency ecosystem is currently characterized by unnecessary factions, as different projects claim superiority over another, statistics present a strong argument that there is room big enough for all of them to thrive.

It seems that the most recent Bitcoin sell-off could have been caused by miners selling large quantities of Bitcoin on exchanges. According to the blockchain data provider Cryptoquant,  BTC Miners’ Position Index reached the highest level in three months, meaning that they are cashing out on their assets. The same happened in September right before Bitcoin’s sharp sell-off from around $12,000 to $10,000.

The major economic events deciding the movement of the pair in the next week are Retail Sales monthly report, EIA Crude Oil Stocks Change, Fed Interest Rate Decision at Dec 16, Building Permits, and Initial Jobless Claims at Dec 17 for US.

BTC/USD Weekly outlook:

Technical View:

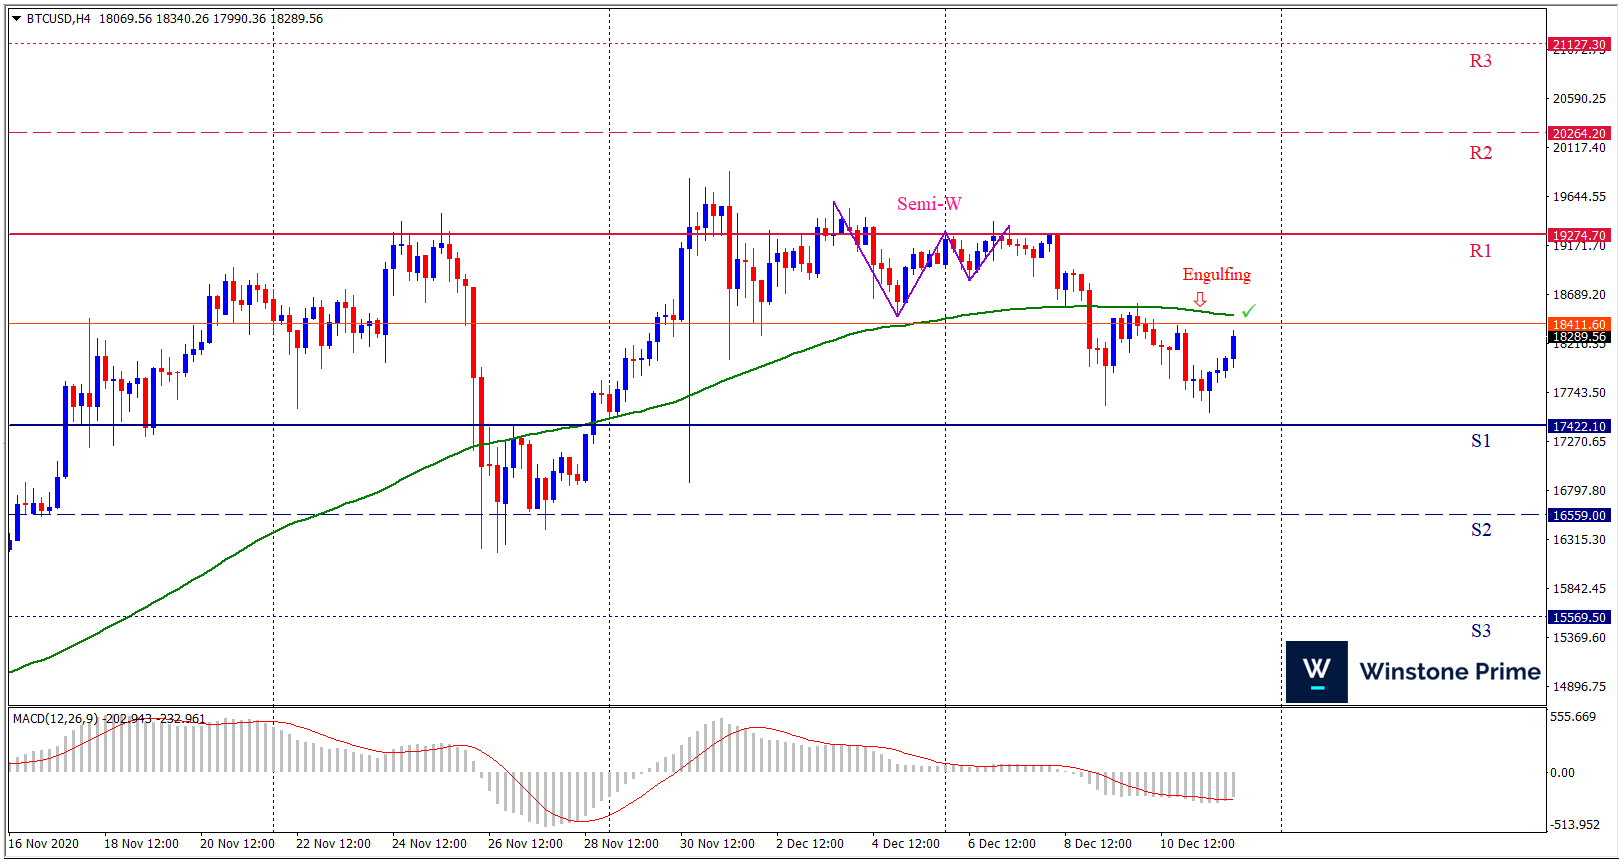
Last week’s high was 2.43% lower than the previous week. Maintaining high at 19401.1 and low at 17548.5 showed a movement of 1852 pips.

In the upcoming week we expect BTC/USD to show a bearish trend. The Instrument is trading below the 100 Simple Moving Average and the MACD trades to the downside. A solid breakout below 17422.1 may open a clean path towards 16559.0 and may take a way down to 15569.5. Should 19274.7 prove to be unreliable resistance, the BTCUSD may raise upwards 20264.2 and 21127.3 respectively. In H4 chart semi-w chart pattern formation favors prospects of a bearish trend. Bearish engulfing pattern constructs a bearish outlook for the pair in the upcoming week.

Preference
Sell: 18299.5 target at 16560.2 and stop loss at 19279.7


Alternate Scenario
Buy: 19279.7 target at 21126.2 and stop loss at 18299.5

USD/JPY Weekly Forecast (14th December 2020 – 18th December 2020)

Fundamental view:

The US dollar has rallied a bit against the Japanese yen in the previous week. In Japan the most up-to-date information, the Eco Watchers Surveys, Outlook and Current for November from the Cabinet Office, saw sharp declines from their pandemic highs in October.

US Revised Nonfarm Productivity quarterly report & Revised Unit Labor Costs quarterly report on 8th Dec and US JOLTS Job Openings on 9th Dec favors uptrend for the pair whereas US Consumer Credit monthly report & Japan Final GDP Price Index yearly report on 8th Dec and US Federal Budget Balance on 11th Dec favors downtrend for the pair.

The major economic events deciding the movement of the pair in the next week are Japan Markit Manufacturing PMI, US Retail Sales monthly report, Fed Interest Rate Decision at Dec 16, US Building Permits, US Initial Jobless Claims at Dec 17, and BoJ Interest Rate Decision at Dec 18.

USD/JPY Weekly outlook:

Technical View:

Last week’s high was 0.17% lower than the previous week. Maintaining high at 104.57 and low at 103.82 showed a movement of 75 pips.

In the upcoming week we expect USD/JPY to show a bullish trend. The currency pair is trading below the 200 Simple Moving Average and the MACD trades to the downside. A solid breakout above 104.47 may open a clean path towards 104.90 and may take a way up to 105.22. Should 103.72 prove to be unreliable support, the USDJPY may sink downwards 103.40 and 102.97 respectively. In H4 chart, Formation of bullish shark pattern indicates reversal of the trend creating prospects of a bullish trend Along with a bullish spinning top formation braces our expectation.

Preference
Buy: 104.00 target at 104.73 and stop loss at 103.68


Alternate Scenario
Sell:  103.68 target at 102.98 and stop loss at 104.00

XAU/USD Weekly Forecast (14th December 2020 – 18th December 2020)

Fundamental view:

The vaccines are coming – we’re saved! Although the arriving vaccines are great for humanity, they are bad for the price of gold. In November, Pfizer and BioNTech announced that their mRNA-based vaccine candidate, BNT162b2, had demonstrated evidence of an efficacy rate above 90% against COVID-19, in the first interim efficacy analysis.

At the start of the week, the data from China showed that the country’s exports in November surged by 21.1% on a yearly basis. With this reading surpassing the market expectation for an increase of 12% by a wide margin, risk flows remained in control of financial markets. 

The major economic events deciding the movement of the pair in the next week are Retail Sales monthly report, EIA Crude Oil Stocks Change, Fed Interest Rate Decision at Dec 16, Building Permits, and Initial Jobless Claims at Dec 17 for US.

XAU/USD Weekly outlook:

Technical View:

Last week’s high was 1.47% higher than the previous week. Maintaining high at 1875.2 and low at 1821.7 showed a movement of 535 pips.

In the upcoming week we expect XAU/USD to show a bearish trend.  The Instrument is trading below the 200 Simple Moving Average and the MACD trades to the downside. A solid breakout below 1815.6 may open a clean path towards 1791.9 and may take a way down to 1762.1. Should 1869.1 prove to be unreliable resistance, the AUDUSD may raise upwards 1898.9 and 1922.7 respectively. In H4 chart inverted cup and handle pattern favors prospects of a bearish trend. Also to be noted hanging man candle formation exerts the expectation of downtrend for the pair.

Preference
Sell:  1833.4 target at 1792.8 and stop loss at 1874.5


Alternate Scenario
Buy: 1874.5 target at 1921.7 and stop loss at 1833.4

GBP/USD Weekly Forecast (14th December 2020 – 18th December 2020)

Fundamental view:

The British pound has gotten hit rather hard during the week, after trying to be somewhat optimistic. Meeting between Boris and Ursula has produced nothing. No deal at dinner but perhaps over the weekend? A nerve-wracking week concludes with growing fears Brexit talks could collapse. Apart from the all-important deliberations, rate decisions on both sides of the pond are eyed.

In the past week, Britain Halifax HPI monthly report on 7th Dec and US NFIB Small Business Index on 8th Dec created bullish atmosphere for the pair whereas US JOLTS Job Openings on 9th Dec and US CPI monthly report on 10th Dec created bearish atmosphere for the pair.

The major economic events deciding the movement of the pair in the next week are UK Claimant Count Change at Dec 14, US Retail Sales monthly report, Fed Interest Rate Decision at Dec 16, US Building Permits, BoE Interest Rate Decision and US Initial Jobless Claims at Dec 17.

GBP/USD Weekly outlook:

Technical View:

Last week’s high was 0.46% lower than the previous week. Maintaining high at 1.3478 and low at 1.3135 showed a movement of 343 pips.

In the upcoming week we expect GBP/USD to show a bearish trend.  The currency pair is trading below the 200 Simple Moving Average and the MACD trades to the downside. A solid breakout below 1.3081 may open a clean path towards 1.2936 and may take a way down to 1.2738. Should 1.3424 prove to be unreliable resistance, the GBPUSD may raise upwards 1.3622 and 1.3767 respectively. Chart formation of symmetrical triangle pattern breakout in H4 chart favors prospects of a bearish trend. Spinning top pattern formation escalates the expectation for a bearish trend.

Preference
Sell: 1.3237 target at 1.2938 and stop loss at 1.3429


Alternate Scenario
Buy:  1.3429 target at 1.3766 and stop loss at 1.3237