Precious metals have long been considered as stores of wealth for thousands of years. Prior to the advent of the fiat currency system, the world’s currencies were directly or indirectly pegged to gold. Some proponents of the latter system still believe that holding precious metals is better than holding currency. Investing money in silver and gold as commodity is simple and profitable. Anyone can learn the easy ways of buying silver and gold as a physical wealth. Since the value of of gold and silver is considerably high, the precious metal constitutes to be great investment option. While people give a lot of opinions, investing in Gold has always comes out as a clear winner.
History of Gold
In 1990, the price of gold was $400 an ounce. From September of 1990 to September of 2005, the price of gold ranged from around $280 to $450 an ounce: a difference of $170 over 15 years. Over the course of any given year, a $40 to $50 move in the price would be considered a big – in a single year. Nowadays, that’s an afternoon. Since September of 2005, the price of gold has been on a historic run – from $450 per ounce to a high of $1,875 per ounce in 2011. Now in pandemic crisis 2020 many one moves towards commodities like Gold and it’s rate reached $2,072 per ounce and now it trades at around $1,923. The average investor probably didn’t pay much attention to the first part of the rally in gold, but once it convincingly crossed $1,000 in 2009, most market watchers keep an eye on gold along with the Dow, the S&P 500, and the price of crude oil.
What was once only watched by central banks, insurance companies, and gold miners suddenly has become as mainstream as IBM and Microsoft. In fact, We would say that gold is even bigger. Whenever the financial crisis happens Gold always stands as the Safe haven and many people flocked to gold as a “safe haven” investment. The average small retail investor can easily invest in gold through exchange traded funds, or ETFs.
But what about other precious metals? What about silver? Silver has had an impressive run up in price as well, and may even have more upside than gold over the coming months and years.
Gold Has a Much Larger Supply

In absolute terms of mass, silver has a much larger supply than gold. However, due to gold’s rarity, its price is a lot higher. As such, the annual supply in USD is around 12 times larger for gold as compared to silver. That being said, physical gold has many different uses besides investing.
Another important point to remember here is that due to its cheaper price, silver requires a lot more storage space than a similar amount (in USD) of gold. This increases the price of its option contracts and makes it less desirable to individuals as it cannot be efficiently stored in safe-deposit boxes.
Silver is Cheap
Despite many disadvantages, the one advantage that silver has over gold is its lower price. This means that it is easier for small-time investors to purchase certain quantities of silver as compared to gold.
Both silver and gold are often sold in the form of bricks and coins, so it is quite difficult to purchase a small amount of an expensive metal like gold. Most investors who want exposure to gold but do not have a lot of money either invest in gold ETFs or gold mining stocks.
Gold
Gold has traditionally been a safe haven for investors who do not believe in the strength of the current economy. This was proven once again during the COVID-19 crisis, as gold gained more than 56% during the first half of 2020. Due to its low volatility, high demand (which is continuously rising as the ramifications of quantitative easing become apparent), and history as the primary store hold of wealth for centuries, gold has always been a part of mainstream finance.
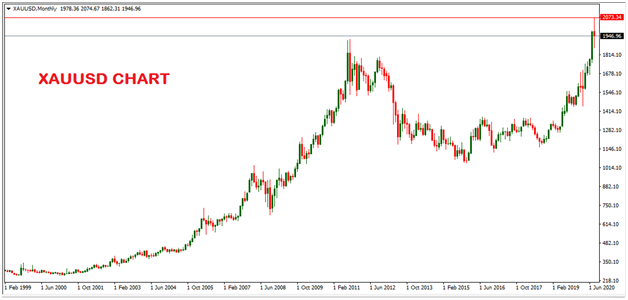
The Federal Reserve printed more than $3 Trillion to counteract the negative consequences of COVID-19. This has led to many investors being wary of extreme inflation in the next few years. Gold has limited supply and it usually rises as the cost of living increases.
Silver
The main advantage that you get when you own physical silver is convenience. Not only you can purchase silver quite easily, but it is also easier to offload as compared to gold. Meeting a small financial need is much easier with silver due to it being only a fraction of the price of gold.
Another important point to note is that the demand for silver is rising, both in industry as well as consumers (as investment as well as jewelry). Apart from by the investors, silver is also considered a precious metal because of its application, including its use in industries like mobile hand-sets, glass, normal lead acid batteries, solar panels, electric conductors, computers and soon. It is a surprise to see that no other metal has been able to replace silver in this industry. Additionally silver is used in many life saving medicines as well.
Silver has been on a constant downfall in the last decade. At its highest, it hit $50/ounce. However, it finished 2019 at a very modest price of $17.83/ounce. Due to this, silver is being mined less and less each passing year. Once you couple the increase in demand with a fall in supply, it is easy to see how profitable an investment in silver could be.
However, you must not forget the risks associated with silver. Due to it being so readily available and cheap, all these factors could change in an instant. It is also important to remember that until the complete effects of COVID-19 become apparent, there is still a chance of a continued decline of industrial silver demand which may hamper its price.
Silver Performs Worse in Crashes
We mentioned previously how silver seems to perform much more in tandem with the economy as opposed to gold which rises in price during a crash. The simple reason for this is that silver is used abundantly in industry. Over half of the silver mined every year is utilized in industry. When the economy collapses, factories often reduce their output or shut down entirely. As such, the demand for silver falls massively. This leads to silver often falling in price during a crash, despite many investors flocking to it as a safe asset.
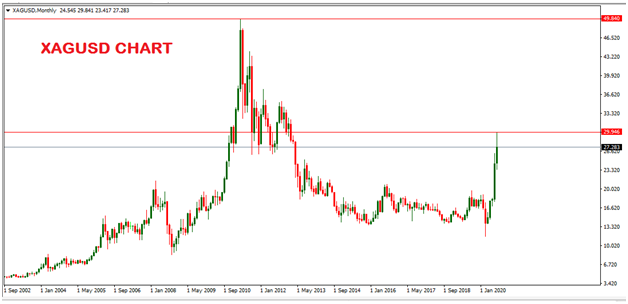
And also it was noted after US ‘2008 debt crisis, the world bought both gold and silver in bulk. This resulted in dramatic increase in the price of silver and gold between from 2008 to 2013. At that time of price of silver went up to nearly Dollars 45 per ounce. Currently the craze of silver bubble has fizzed out but gold still continues to shine and now pandemic corona crisis increases the price of Gold and silver.
Its properties as a conductor of heat as well as electricity, along with its reflective nature, make it ideal for many industries. Until a better alternative is found, silver will always be more volatile than gold.
Conclusion
Right now, less than 1% of the world’s total wealth is invested in gold and silver. Even a minor increase in this percentage could have a significant impact on their prices. What is even more interesting is that the demand does seem to be gradually increasing. So much so that mining cannot keep up with it!
This means that you might see favorable returns on your investment regardless of which metal you invest in. However, the purpose of gold and silver is very different. As such, they are for people of very different mindsets.
Generally speaking, gold is for more conservative-minded investors. While it is possible to see higher returns in silver, you will need to time your exits and entries into the commodity in order to do that. Gold, on the other hand, is great for investors who want to sleep well.
Do remember that gold should only be a small part of your portfolio usually. If you begin to see a crisis looming ahead that may cause uncertainty in the markets, only then should you flock to gold before everyone else does and raises its price.
Silver is a lot more of an opportunistic investment. Due to its volatility, it can give returns that are much better than gold in certain conditions. However, silver does not tend to fare well when held for a long time.
Our advice is that conservative investors who are looking to hedge their portfolio with precious metals should stick with gold. Only those who understand the world of commodities in depth should try to trade silver. Those with experience could quite possibly greatly enhance their returns if they invest in silver at the right time. Novice investors, on the other hand, will probably lack sufficient knowledge to trade it effectively.