BTC/USD Weekly Forecast (7th December 2020 – 11th December 2020)

Fundamental view:

Bitcoin has been one of the best assets this year despite the coronavirus pandemic. After hitting a low of $4,000 on many exchanges in March, the flagship cryptocurrency is currently trading at $19,000 and aiming for new all-time highs.

Bitcoin’s move to the new all-time high was followed by massive profit-taking triggered a cascading leveraged positions liquidation, which is a natural thing on the cryptocurrency market. According to ByBit, over 81,000 traders were kicked out from the market, with the positions worth over 30,000 BTC were liquidated in a matter of hours. The largest single liquidation took place on Huobi, where a trader lost about $6 million. 

Moreover, Bitcoin is now regarded as a more attractive investment and a store of value than gold. Considering the seismic shifts in the market sentiments, the digital coin may soon outshine its physical counterpart.

The major economic events deciding the movement of the pair in the next week are Nonfarm Productivity quarterly at Dec 08, JOLTS Job Openings, EIA Crude Oil Stocks Change at Dec 09, Initial Jobless Claims at Dec 10, and CPI monthly report at Dec 11 for US.

BTC/USD Weekly outlook:

Technical View:

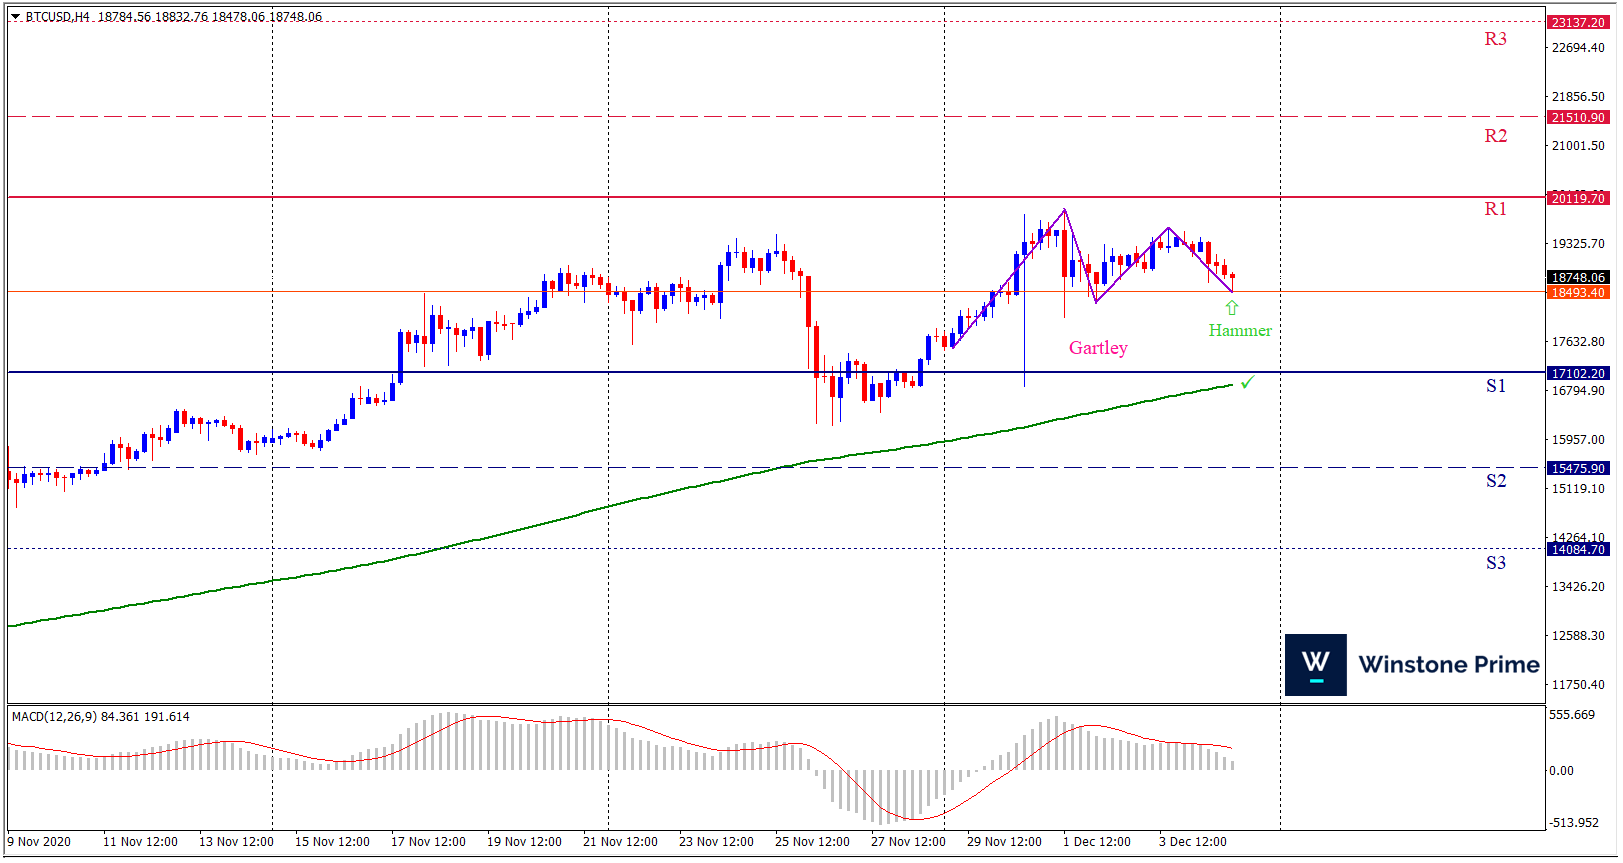
Last week’s high was 2.10% higher than the previous week. Maintaining high at 19884.6 and low at 16867.1 showed a movement of 3017 pips.

In the upcoming week we expect BTC/USD to show a bullish trend. The Instrument is trading above the 200 Simple Moving Average and the MACD trades to the downside. A solid breakout above 20119.7 may open a clean path towards 21510.9 and may take a way up to 23137.2. Should 17102.2 prove to be unreliable support, the BTCUSD may sink downwards 15475.9 and 14084.7 respectively. In H4 chart bullish gartlay pattern formation favors prospects of a bullish trend. Hammer pattern constructs a bullish outlook for the pair in the upcoming week.

Preference
Buy: 18735.7 target at 21209.2 and stop loss at 16995.5


Alternate Scenario
Sell: 16995.5 target at 14085.7 and stop loss at 18735.7

EUR/USD Weekly Forecast (7th December 2020 – 11th December 2020)

Fundamental view:

The Euro broke higher during the course of the week, slicing through the 1.21 level, a level that was last seen in April 2018. Market players had loads to digest this week, starting with a quite encouraging factor. On Tuesday, a group of US bipartisan lawmakers offered a new $908 billion COVID-19 relief package. Talks between House Speaker Nancy Pelosi and Senate Majority Leader Mitch McConnell stalled ahead of the presidential election, but negotiations made an explosive comeback, as the new amount triples the previous highest proposal. US Federal Reserve Chair Jerome Powell and Treasury Secretary Steven Mnuchin had urged Congress to approve an aid program, to support the economy through the winter. Stimulus-related news fell short of boosting equities, as Wall Street spent most of the week in the red.

In the past week, Italian Manufacturing PMI on 1st Dec and US Natural Gas Storage on 4th Dec created bearish atmosphere for the pair whereas Europe Spanish Flash CPI yearly report on 30th Nov and US ISM Manufacturing PMI on 1st Dec created bullish atmosphere for the pair.

The major economic events deciding the movement of the pair in the next week are Euro Employment Change quarterly report, Euro GDP quarterly report, US Nonfarm Productivity quarterly at Dec 08, US JOLTS Job Openings at Dec 09, ECB Interest Rate Decision, Initial Jobless Claims at Dec 10, and US CPI monthly report at Dec 11.

EUR/USD Weekly outlook:

Technical View:

Last week’s high was 1.80% higher than the previous week. Maintaining high at 1.2177 and low at 1.1923 showed a movement of 254 pips.

In the upcoming week we expect EUR/USD to show a bearish trend. The currency pair is trading above the 200 Simple Moving Average and the MACD trades to the downside. A solid breakout below 1.1970 may open a clean path towards 1.1819 and may take a way down to 1.1716. Should 1.2224 prove to be unreliable resistance, the EURUSD may raise upwards 1.2327 and 1.2478 respectively. Chart formation of a rising wedge pattern breakout in H4 chart sets prospects for a bearish trend. Harami formation in H4 chart escalates the expectation for a bearish trend.

Preference
Sell: 1.2162 target at 1.1924 and stop loss at 1.2229


Alternate Scenario
Buy:  1.2229 target at 1.2477 and stop loss at 1.2162

XAU/USD Weekly Forecast (7th December 2020 – 11th December 2020)

Fundamental view:

After starting the week on the back foot and printing fresh multi-month lows, the XAU/USD pair reversed its direction and snapped a three-week losing streak. Fueled by the broad-based USD weakness, the pair gained more than 2.5% on a weekly basis. The last nonfarm payroll report of the year was quickly shrugged off as softness in hiring should keep pressure on Congress to deliver another stimulus package before the holidays.  The knee-jerk reaction for US stocks was an initial drop following the disappointing employment report. 

State and local aid for governments remains the key hurdle and at some point, over the next week, Senate Majority McConnell will need to make a concession or he could risk providing added motivation for Democratic voters for the two Georgia senate runoff races on January 5th.  White House adviser Kudlow did not provide any hints Republicans are closer to budging, keeping the uncertainty in place over the timeframe on when a deal will happen.           

The major economic events deciding the movement of the pair in the next week are Nonfarm Productivity quarterly at Dec 08, JOLTS Job Openings, EIA Crude Oil Stocks Change at Dec 09, Initial Jobless Claims at Dec 10, and CPI monthly report at Dec 11 for US.

XAU/USD Weekly outlook:

Technical View:

Last week’s high was 1.49% lower than the previous week. Maintaining high at 1848.1 and low at 1764.3 showed a movement of 838 pips.

In the upcoming week we expect XAU/USD to show a bullish trend.  The Instrument is trading above the 50 Simple Moving Average and the MACD trades to the upside. A solid breakout above 1867.6 may open a clean path towards 1899.8 and may take a way up to 1951.4. Should 1783.7 prove to be unreliable support, the XAUUSD may sink downwards 1732.1 and 1699.9 respectively. In H4 chart ascending scallop pattern favors prospects of a bullish trend. Also to be noted Spinning top formation exerts the expectation of uptrend for the pair.

Preference
Buy: 1834.5 target at 1898.2 and stop loss at 1781.4


Alternate Scenario
Sell: 1781.4 target at 1702.7 and stop loss at 1834.5

AUD/USD Weekly Forecast (7th December 2020 – 11th December 2020)

Fundamental view:

The AUD/USD pair has extended its 2020 rally to 0.7449 this week, ending it a handful of pips below it. The Australian dollar has been steadily but painfully advancing against its American rival, and the main reason behind it seems to be the tepid tone of equities. Good news flooded Australia this week, as the country is officially out of recession, as the Q3 Gross Domestic Product surged by 3.3% QoQ, beating expectations. Even further, the country seems to have coronavirus under control while the US reaches grim record contagions and deaths. Victoria has gone over a month without new contagions, while there were no new cases reported in South Australia. The country has reported less than 20 cases per day in the last two weeks. Restrictions are slowly being lifted, and the economy is moving into normal.

In the past week,Australia Company Operating Profits on 30th Nov and US Factory Orders monthly report on 4th Dec created a bearish atmosphere whereas Australia Building Approvals monthly report on 1st Dec and US ADP Non-Farm Employment Change on 2nd Dec created bullish atmosphere for the pair.

The major economic events deciding the movement of the pair in the next week are NAB Business Confidence, US Nonfarm Productivity quarterly at Dec 08, US JOLTS Job Openings at Dec 09, RBA Bulletin, Initial Jobless Claims at Dec 10, and US CPI monthly report at Dec 11.

AUD/USD Weekly outlook:

Technical View:

Last week’s high was 0.68% higher than the previous week. Maintaining high at 0.7449 and low at 0.7338 showed a movement of 111 pips.

In the upcoming week we expect AUD/USD to show a bearish trend.  The currency pair is trading above the 200 Simple Moving Average and the MACD trades to the downside. A solid breakout below 0.7363 may open a clean path towards 0.7295 and may take a way down to 0.7252. Should 0.7473 prove to be unreliable resistance, the AUDUSD may raise upwards 0.7517 and 0.7584 respectively. In H4 chart bearish butterfly pattern favors prospects of a bearish trend. Also to be noted three inside down pattern formation exerts the expectation of downtrend for the pair.

Preference
Sell: 0.7434 target at 0.7315 and stop loss at 0.7478


Alternate Scenario
Buy:  0.7478 target at 0.7583 and stop loss at 0.7434