GBP/USD Weekly Forecast (7th December 2020 – 11th December 2020)

Fundamental view:

The British pound has made a rally against greenback in the past week. The vaccine approval and hopes for US fiscal stimulus were decidedly positive, and all three themes will likely dominate the scene again, with UK growth and US consumer statistics having their time in the sun as well. Also Traders are essentially putting money to work ahead of the weekend, assuming that there will be some type of Brexit announcement. It does look more likely than not these days, but if it does not happen, this could set up nothing sort of a disaster for this pair.

In the past week, Britain M4 Money Supply m/m & Net Lending to Individuals monthly report on 30th Nov and Britain BRC Shop Price Index on 2nd Dec created a bearish atmosphere and US Pending Home Sales m/m & Chicago PMI on 30th Nov and Britain Nationwide HPI monthly report on 1st Dec created a bullish atmosphere for the pair.

The major economic events deciding the movement of the pair in the next week are US Nonfarm Productivity quarterly at Dec 08, US JOLTS Job Openings at Dec 09, UK Manufacturing Production monthly report, UK GDP monthly report, Initial Jobless Claims at Dec 10, and US CPI monthly report at Dec 11.

GBP/USD Weekly outlook:

Technical View:

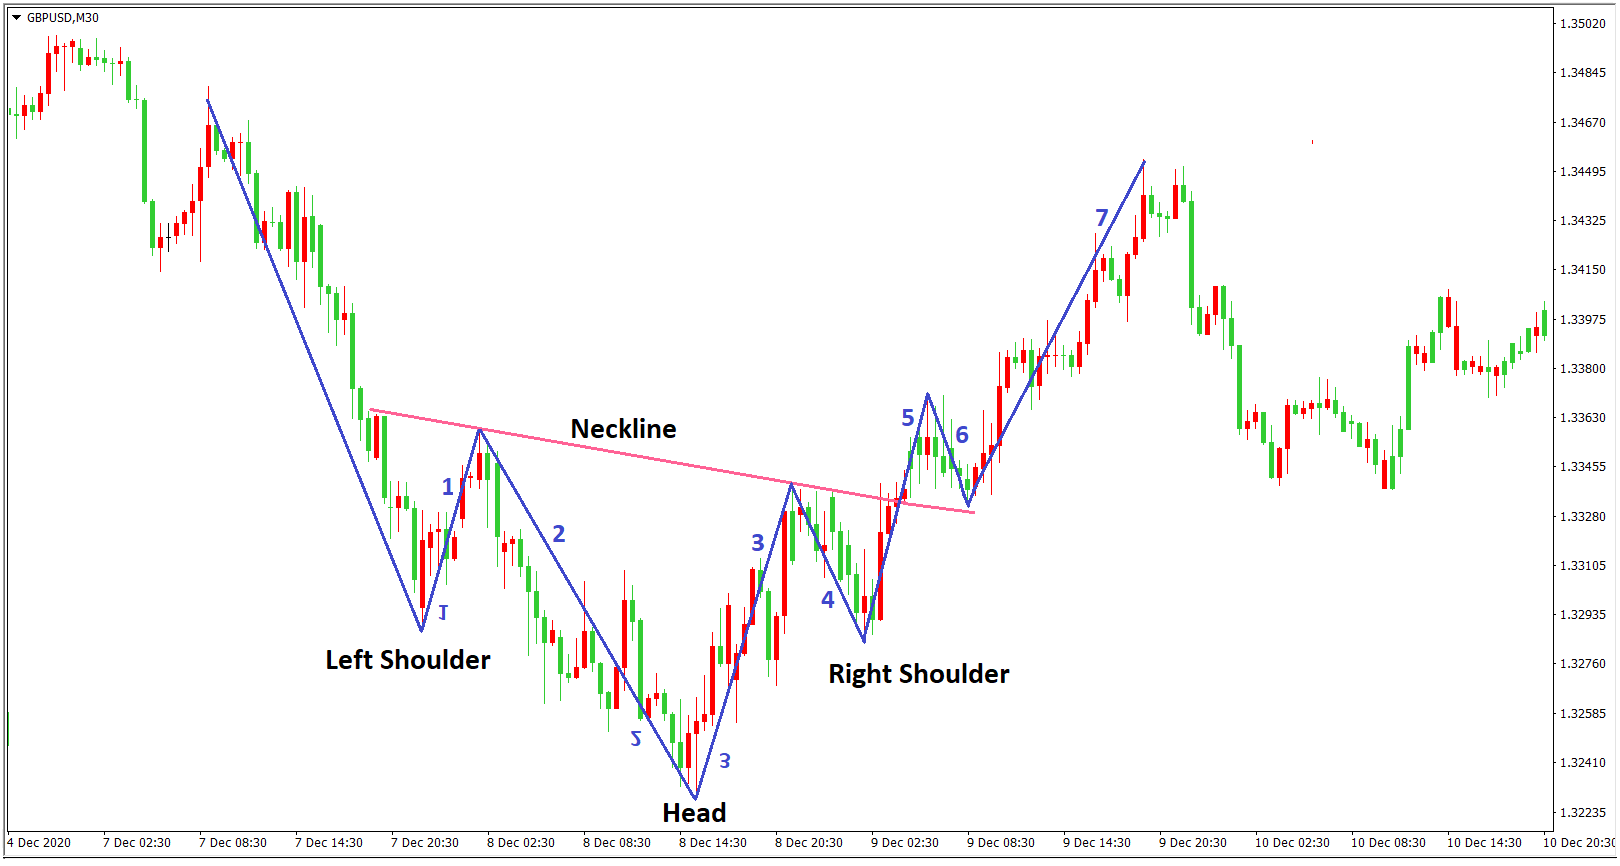
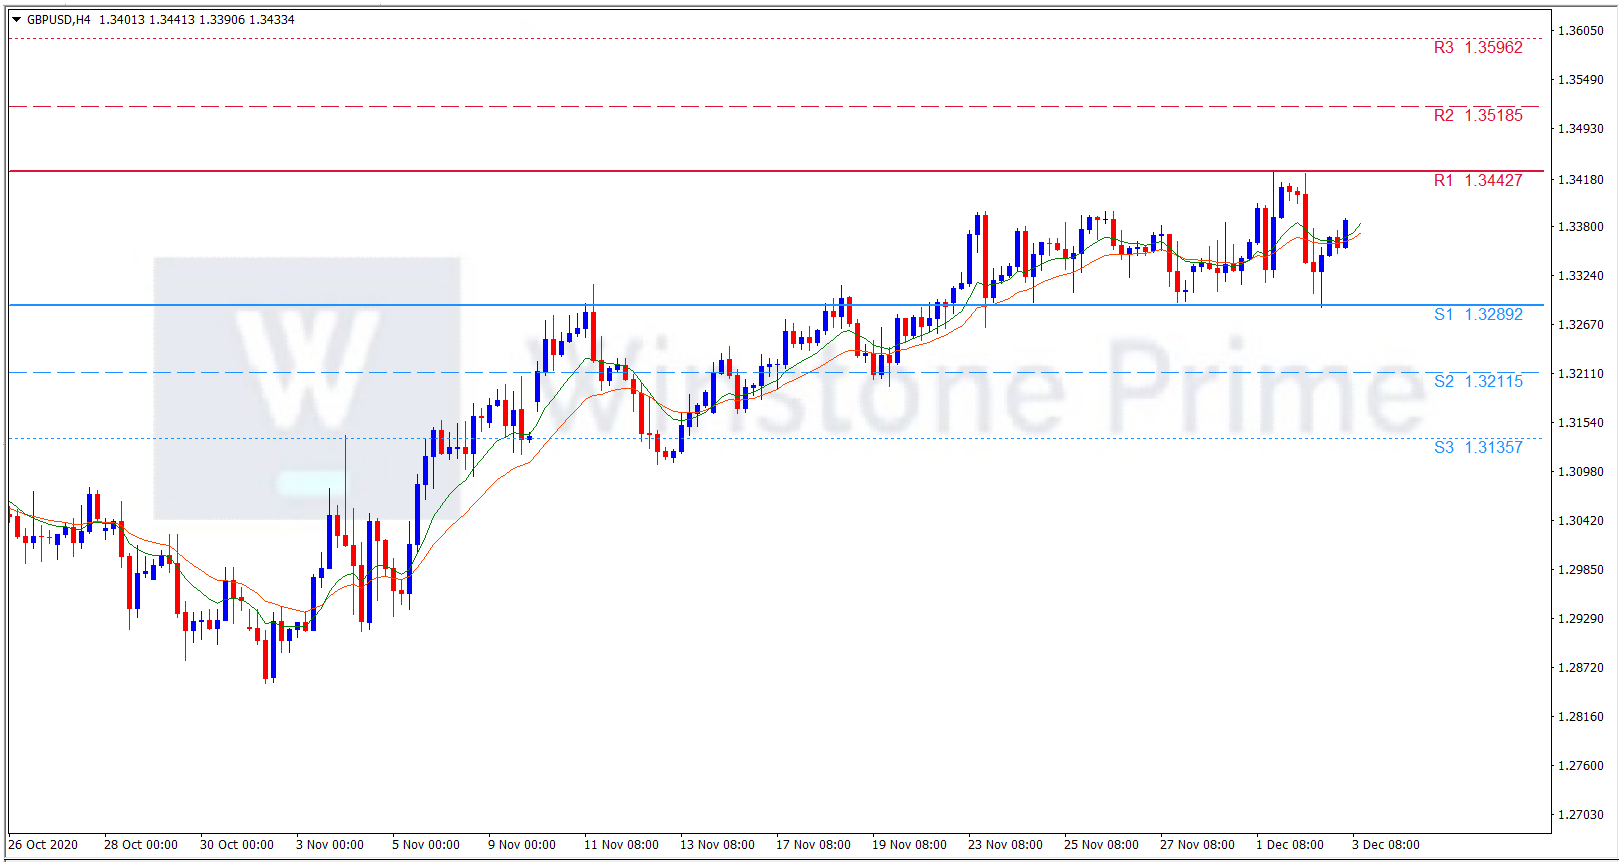
Last week’s high was 1.06% higher than the previous week. Maintaining high at 1.3539 and low at 1.3287 showed a movement of 252 pips.

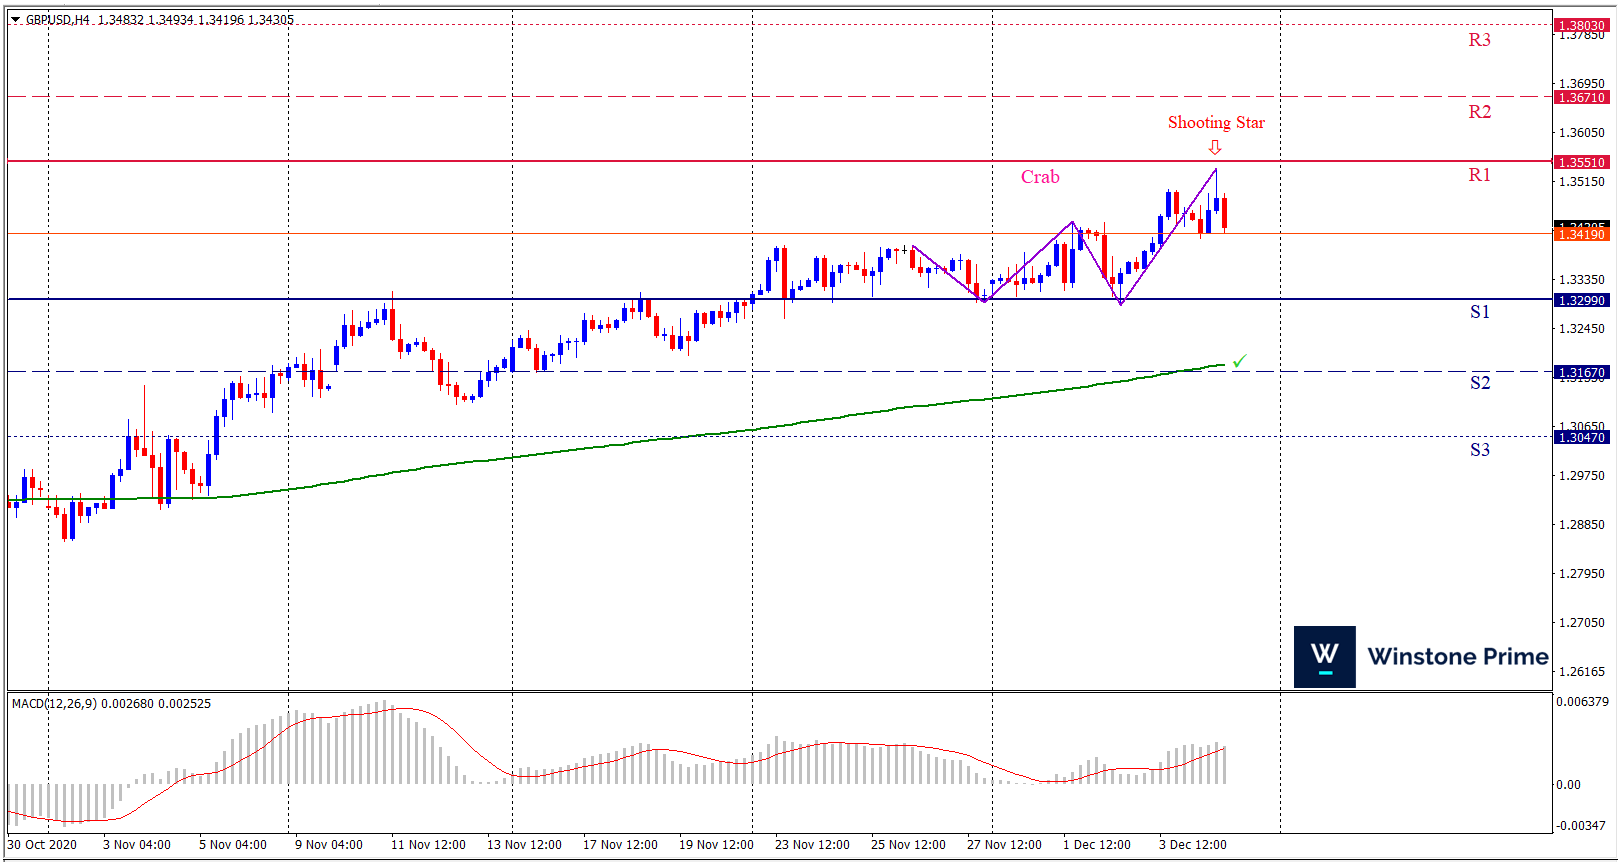
In the upcoming week we expect GBP/USD to show a bearish trend.  The currency pair is trading above the 200 Simple Moving Average and the MACD trades to the upside. A solid breakout below 1.3299 may open a clean path towards1.3167 and may take a way down to 1.3047. Should 1.3551 prove to be unreliable resistance, the GBPUSD may raise upwards 1.3671 and 1.3803 respectively. Chart formation of bearish crab pattern in H4 chart favors prospects of a bearish trend. Shooting star pattern formation escalates the expectation for a bearish trend.

Preference
Sell: 1.3434 target at 1.3168 and stop loss at 1.3556


Alternate Scenario
Buy:  1.3556 target at 1.3802 and stop loss at 1.3434

Inverse Head & Shoulders Trading Strategy

The Inverse Head and Shoulders Chart Pattern Trading Strategy is a price action trading strategy.

It is exactly the opposite of the head and shoulder chart pattern trading strategy.

This chart pattern is considered a bullish reversal chart pattern. That means if we see this chart pattern in a downtrend, then it may act as a signal that the downtrend is ending and therefore we should be looking to buy.

Timeframes : 5 minutes and above.

Instrument : Any

Indicators : None required.

Here’s what an inverse head and shoulders pattern look like:

Forming of Inverse head and shoulders pattern:

Now let’s look at what each of the number from 1 to 7 on the head and shoulders pattern mean:

  • Buyers come in at the low (which is the left shoulder) and push the price up (which results in a beginning neckline).
  • Then next what happens is the sellers return to the market and push prices to new lows(which is the inverted head).
  • But the new low is not sustained as price rises back up as buyers push price up to create a continuing neckline.
  • Again sellers enter pushing the price down to a low, but this low does not exceed the previous low (the head). This low forms the right shoulder.
  • Again Buyers get in and push the price up and now this time the neckline is intersected to the upside.
  • Seller may get in here and push price down to test the neckline that was intersected which would now act as a support line.
  • Buyers get in push the price up-now and an uptrend is in progress.


Trading Rules :

There are two options on how you can trade the inverse head and shoulders pattern:

1st Option:

  • Wait until the candlestick breaks neckline to the upside.
  • Now place a buy stop order just a few pips (at least 3 -5 pips) above the high of the candlestick intersects the neckline.
  • Then place your stop 3-5 pips below the low of the right shoulder.


2nd Option:

  • Wait until the price breaks the neckline; just wait for price to pull back down to touch the neckline which it intersected. This intersected neckline would now act as a support line.
  • After it touches the neckline, place a buy stop order 3-5 pips above the high of the candlestick that touches the neckline.
  • Then place you stop loss anywhere from 10-25 pips depending on which timeframe trading in just below were your buy stop order is placed.
  • Try to use the bullish reversal candlestick patterns as your short entry confirmation on this option 2 entry style.

Let us explain with a chart below:

Take Profit :

There are 2 options for placing your take profit targets:

  • Set Take profit at 1:2 times the amount you risked in pips.
  • The other option would be to see a previous swing high point where price moved down from, and use that level as your take profit target.

Oil rally favors Canadian dollar

The USD/CAD pair is getting weaker. The oil rally seems to be supporting the Canadian dollar. West Texas Intermediate (WTI) crude, the North American oil benchmark, is trading 1.8% higher on the day near $46.40 per barrel. On Thursday, the OPEC+, a group of major producers led by Saudi Arabia and Russia, reached an agreement to add in 500,000 barrels per day in January to its oil production quotas. The total production cut in January will now be 7.2 million barrels per day (bpd) versus 7.7 million bpd as of now.

Asides from the oil rally, the broad-based US dollar weakness looks to be keeping the USD under lot of pressure. The sentiment around the dollar remains bearish on hopes for a quick global economic recovery on potential corona virus vaccines and expectations for additional fiscal stimulus.  The corona virus economic aid bill should be passed with signs of consensus growing around the $900 billion plan, President-elect Joen Biden told on wire.

Biden told “The $900 billion stimulus package is a “good start”.. After swearing in, I am going to have to ask for more to get things done.”

The US Government has reduced the maximum validity length of the B1/B2 non-immigrant business and tourist visas for China’s ruling Communist Party and their families in a bid to protect the nation from malign influence.

The US dollar is likely to remain on the offer at least for six months, having declined by 12% against majors this year,  a poll of currency strategists found. While 51 or 72 analysts called for a continued downtrend until mid-2021 on expectations for corona virus-vaccine led economic recovery and hopes for additional US fiscal stimulus, the remaining 21 said it would end before.

The narrative of potential corona virus vaccines leading to swift global economic recovery is currently dominating the market sentiment.

USD/CAD 4 Hour Chart:

Support: 1.2833 (S1), 1.2798 (S2), 1.2744 (S3).

Resistance: 1.2922 (R1), 1.2976 (R2), 1.3011 (R3).

In the prevailing atmosphere, a broad based US dollar weakness is expected to continue and we expect a bearish trend for USD/CAD.

Dollar weakness favors Pound

The dollar became weaker and slid to a 2-1/2-year low against a basket of major currencies on Thursday as investors wagered that more economic stimulus from Washington and the expected start of COVID-19 vaccinations would support riskier assets.

Bets on a successful roll-out of vaccines and China’s economic rebound are driving bets for global growth and against the world’s reserve currency. Some on Wall Street are warning that the greenback will undergo a bearish cycle with the Federal Reserve keeping rates low for years. Fed Chair Jerome Powell said Wednesday that the central bank will keep rates low until the economy is “very clearly past the danger” from the pandemic. During the global financial crisis, when the U.S. central bank employed quantitative easing, the dollar had gone through a similar decline.

On the other hand, U.S. legislators have failed to reach agreement on fresh relief for a pandemic-hit U.S. economy, there were early signs that a $908 billion bipartisan proposal could be gaining traction. Investors expect lawmakers to reach a deal eventually with the two parties also facing a Dec. 11 deadline to pass a $1.4 trillion budget or risk a shutdown of the government.

Britain on Wednesday approved a COVID-19 vaccine developed by Pfizer and BioNTech and said it would start vaccinating those most at risk early next week.

“Britain is starting vaccination and the U.S. is also expected to do so in coming weeks while coronavirus infections appeared to have peaked in Europe and the same could be said for the U.S. as well,” said Yujiro Goto, chief strategist at Nomura Securities.

GBP/USD 4 Hour Chart:

Support: 1.3289 (S1), 1.3212 (S2), 1.3136 (S3).

Resistance: 1.3443 (R1), 1.3519 (R2), 1.3596 (R3).

Amidst all the catalysts creating a favorable atmosphere for Pound, we expect a bearish trend for GBP/USD.