Dollar weakness and strong Eurozone data supports Euro

Euro has gained strength against dollar in a single-day percentage gain in nearly nine months. The Euro’s rise is remarkable, given it is happening just days before the European Central Bank’s Dec. 10 meeting, where policymakers are expected to announce additional monetary easing measures.

The bearish sentiment around the dollar looks to be powering gains in the Euro. The dollar is on the defensive and could continue to lose ground ahead of Christmas on hopes for a swift global economic recovery on the back of potential coronavirus vaccines.

Markets are also betting on easing of the US-China tensions under the US President-elect Joe Biden’s leadership. According to The New York Times, Biden has called on Congress to pass a substantial relief package to help keep businesses, households, and local governments afloat.  That has revived hopes for additional fiscal stimulus, adding to bearish pressures around the dollar.

Stronger than expected data also lent support to the euro. Germany reported a surprise drop in unemployment rolls that helped ease the unemployment rate. Manufacturing PMI for the Eurozone was revised higher, offsetting the sting of lower inflation.

Last month’s aggressive lockdowns in Europe are finally bearing fruit as there are signs that Europe’s COVID-19 outbreak is slowing. New virus cases in France fell to 4,005 on Monday from a peak above 86,000 in early November. Virus cases in Spain are just above 10,000, down from more than 25,000 on Oct. 30. In Italy, there were 16,370 new cases yesterday compared with 40,902 on Nov. 13. The numbers are better in Germany as well, but more volatile. The U.S., on the other hand, is bracing for the worst as test results from Thanksgiving gatherings start to come in.

The Dollar Index is still trading near 2.5-year lows. Concerns about a spike in coronavirus cases after Thanksgiving and Federal Reserve Chairman Jerome Powell’s promise to keep interest rates low until there are actual signs of inflation give investors very little reason to buy U.S. dollars.

EUR/USD 4 Hour Chart:

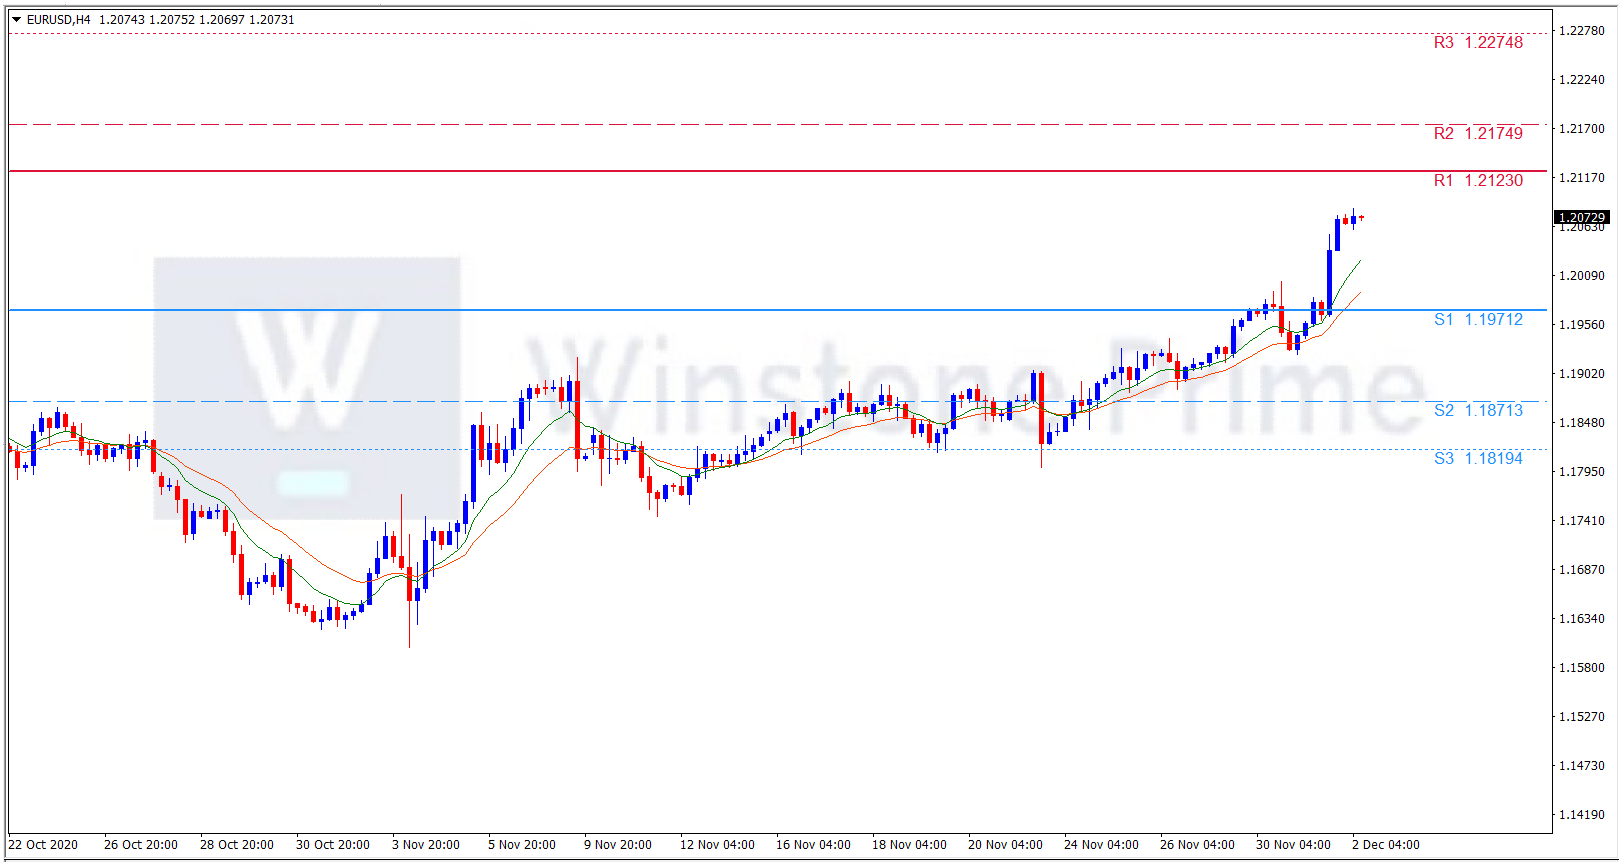
Support: 1.1971 (S1), 1.1871 (S2), 1.1819 (S3).

Resistance: 1.2123 (R1), 1.2175 (R2), 1.2275 (R3).

Strong Eurozone data and dollar weakness makes Euro stronger than greenback. We expect a bullish trend for EUR/USD.

The release of China’s Caixin Manufacturing PMI favors Aussie

The Aussie is favored following the release of upbeat China data. The escalating tensions between China and Australia look to be capping gains.

The data was released at 01:45 GMT showed China’s Caixin Manufacturing PMI, which surveys the small and medium-sized export-oriented units, rose to 54.9 in November versus expectations for 53.5 following October’s 53.6. The data has come a day after government PMIs showed a continued rebound from the world’s second-largest economy from the corona virus-induced slowdown seen earlier this year.

Australia’s Building Permits, or the number of approvals for new construction projects, rose 14.3% year-on-year in October following September’s 8.8% jump, the data released early Monday showed. Australia’s current account surplus narrowed to AUD 10 billion in the third quarter from AUD 16.3 billion in the second quarter.

Australian Prime Minister Scott Morrison has demanded an apology for a senior China government official’s tweet showing a doctored image of an Australian soldier killing an Afghan child. China has placed tariffs on key Australian exports like wine in response to what it claims are hostile policies from Canberra, according to Axios.

Adding to the market mood is the US covid stimulus, as indicated by Fed Chair Jerome Powell and US Treasury Secretary Steve Mnuchin in their prepared remarks for today’s testimony. While Fed’s Powell identified moderating economic growth as a risk that needs an economic push, Treasury Secretary Mnuchin directly urged Congress to use $455 billion from CARES Act to provide the much-needed relief.

Also to be noted that Moderna’s readiness to apply for the emergency usage of its virus vaccine to the US Food and Drug Administration (FDA) also favors the risk-on mood. As a result, stocks in Asia-Pacific join the US 10-year Treasury yields to portray the market optimism.

AUD/USD 4 Hour Chart:

Support: 0.7317 (S1), 0.7294 (S2), 0.7248 (S3).

Resistance: 0.7385 (R1), 0.7430 (R2), 0.7453 (R3).

As of now, AUD gains strength against greenback amidst the existing catalysts, we expect a bullish trend for AUD/USD. Whether US ISM Manufacturing PMI makes any future change is yet to be seen.

Head and Shoulder Trading Strategy

The head and shoulder chart pattern is mostly seen in uptrend’s and is based on a reversal pattern, we will learn how to trade this pattern by learning to recognize this pattern when it starts to form and then trading it.

This strategy is opposite of inverse head and shoulder trading strategy.

What is the head and shoulders pattern and how does it look like?

The head and shoulder chart pattern can from in any time frames ranging from 1 minute up to the monthly time frame.

This is how chart of what head and shoulder chart pattern look like:

Timeframes : Preferably 5 minutes and above.

Instrument : Any

Indicators : None Required.

Let us understand using a chart:

1. Sellers come in at the highs (left shoulder) and thus probing the downside which results in a beginning of neckline.

2. Soon after that buyers return to the market and give a push prices to new highs (the head).

3. But, the new high (head) is not sustained as price falls back down due to sellers pushing price down to create a continuing neckline.

4. Buyers enter again pushing the price up to a high, but this high does not exceed the previous high (the head). The next high is the right shoulder.

5. Sellers enter in to the trade and push the price down and this time the neckline is intersected.

6. Buyers may get in here and push price up to test the neckline that was intersected which would act as resistance

7. Sellers get in and push the price down.

How the Head and shoulder chart is formed?

Price does not rise or fall all the time. There are always times when it will reverse and go in the opposite direction.

So, if the market is in an uptrend, it does not always keep going up because sooner or later the uptrend will slow down and the forces of demand and supply will balance out and this can result in the head and shoulder pattern being formed.

Pattern 1:

Pattern 2 :

Trading Rules :

There are two options on how we will trade the head and shoulder pattern:

1st Option :

  • Wait till the candlestick break the neckline to the downside.
  • Now Place a sell stop order just few pips (minimum of 3 to 5 pips) under the low of the candlestick.
  • And Place a stop loss of 3-5pips above the high of the right shoulder.


2nd Option :

  • After price breaks the neckline, wait for the price to rally back up to touch the neckline which it intersected. This intersected neckline is the resistance.
  • After it touches the neckline, Place a sell stop order 3-5 pips under the low of the candlestick that touches the neckline.
  • Then Place stop loss anywhere from 10-50 pips depending on the timeframe of the chart and above where our sell stop order is placed.
  • Use reversal candlestick patterns as our short entry confirmation on this option 2 entry style.


Take Profit :

  • Set Take profit 1 is to 2 times the amount risked in pips.
  • A second option would see a previous swing low point where price moved up from and use that level as take profit target.

Pros :

  • It is easy to identify for more experienced traders.
  • Defined risk and take profit levels.
  • Potential to exploit big market movements.
  • Useful in all markets.


Cons :

  • Difficult to identify for novice traders.
  • Confirmation candle may close far below neckline resulting in large stop loss distances which may need to be reviewed.
  • Price can pullback and retest the neckline often confusing beginner traders.
  • Risk-reward ratios are not always favorable.

Optimistic retails sales report favors Yen

Japan’s October month Retail Sales offered a surprise growth of 6.4% YoY versus market consensus of -7.7%. Further details suggest that the preliminary readings of October’s Industrial Production recovered from -14.5% forecast and -9.0% prior to -3.2% YoY.

Japan’s industrial output rose for the fifth straight month in October, signaling the economy was recovering further from the damage caused by the COVID-19 crisis. The world’s third-largest economy rebounded sharply in the third quarter from a pandemic-induced slump, thanks to surging consumption and exports, but some analysts worry about slowing growth ahead due to a resurgence in coronavirus infections.

Elsewhere, The Trump administration is poised to add China’s top chipmaker SMIC and national offshore oil and gas producer CNOOC to a blacklist of alleged Chinese military companies, according to a document and sources, curbing their access to U.S. investors and escalating tensions with Beijing weeks before President-elect Joe Biden takes office.

It was reported earlier this month that the Department of Defense (DOD) was planning to designate four more Chinese companies as owned or controlled by the Chinese military, bringing the number of Chinese companies affected to 35. A recent executive order issued by President Donald Trump would prevent U.S. investors from buying securities of the listed firms starting late next year.

On the other hand, the market’s risk-tone is also effected with the major coronavirus (COVID-19) vaccine developer’s likeliness to get the regulatory approvals from the UK, Europe, and the US. The same will fasten the process of delivery to the cure of the pandemic that has roiled 2020.  The chatters concerning US President-elect Joe Biden’s team and their next steps, mainly surrounding the fiscal stimulus also work as a catalyst in the market mood.

It should also be noted that the mixed signals relating to the Brexit deal also affect the risk catalysts while fears of the further increase in the covid numbers, until the vaccine hit the floor, offer an extra filter to the market optimism.

USD/JPY 4 Hour Chart:

Support: 103.87 (S1), 103.70 (S2), 103.49 (S3).

Resistance: 104.24 (R1), 104.45 (R2), 104.62 (R3).

While the prevailing catalysts creating favoritism for yen against greenback, we expect a bearish trend for USD/JPY.